Ecommerce Shipping Guide

How to Measure Shipping's Impact on Repeat Purchase Rate

Repeat purchase is where ecommerce actually makes money. Customer acquisition costs keep climbing, and the first order from a new customer is often a loss or a break-even once you count the ad spend, the discount, the platform fee, and the shipping. The second order is a different animal: near-zero acquisition cost, a customer who already trusts the product, and usually a higher order value. That is why repeat purchase rate separates profitable stores from traffic games.

And yet the touchpoint that touches every single order, the one that happens at the peak of the customer's anticipation, is shipping. Every order ends in a delivery experience, and that experience is the last thing a customer remembers before deciding whether to buy again. Most teams can tell you their cost per shipment down to the cent. Almost none of them can tell you what shipping does to their repeat purchase rate. The cost side sits in the P&L; the revenue side is invisible. That invisibility is expensive.

This article makes the case in two directions. First, the damage side: how slow or unpredictable delivery quietly erodes repeat purchases, with a composite example that most DTC teams will recognize. Then the recovery side: how brands like Zappos and Amazon turned delivery into a repeat-purchase engine, and what a subscription brand learned from switching carriers. And then the part you can use on Monday: a measurement framework with the exact data fields and cohort logic you need to turn shipping from a cost line into a measurable retention lever.

Customer receives a parcel on a sunlit suburban porch.
The moment of delivery is the moment a customer remembers you, and decides whether to buy again

Why Repeat Purchase Is Where Shipping Actually Pays Off

The economics of a second order are radically better than the first. When a customer comes back, you skip the acquisition cost entirely, you usually skip the new-customer discount, and returning customers tend to spend more per order because they already know what they like. The profit curve steepens fast after order one, which is why a small lift in repeat purchase rate is worth more than a small cut in shipping cost.

Shipping matters here because it is the only experience that happens on 100% of orders. Product quality matters, but a customer feels product quality only after the box arrives. Customer support matters, but most customers never contact support. Delivery is the one brand interaction that plays out every single time, at the exact moment the customer is most excited: the box on the doorstep. A smooth arrival confirms the brand's promise; a broken one contradicts it.

Most teams still treat shipping as a pure cost. They negotiate carrier contracts, optimize box sizes, and switch services to save a few percentage points on freight. All of that is rational, and none of it is wrong. The problem is asymmetry: shipping savings show up immediately and clearly in the P&L, while the repeat revenue that a bad delivery decision destroys shows up six months later, in a cohort report nobody reads. The cost is real; it is just invisible.
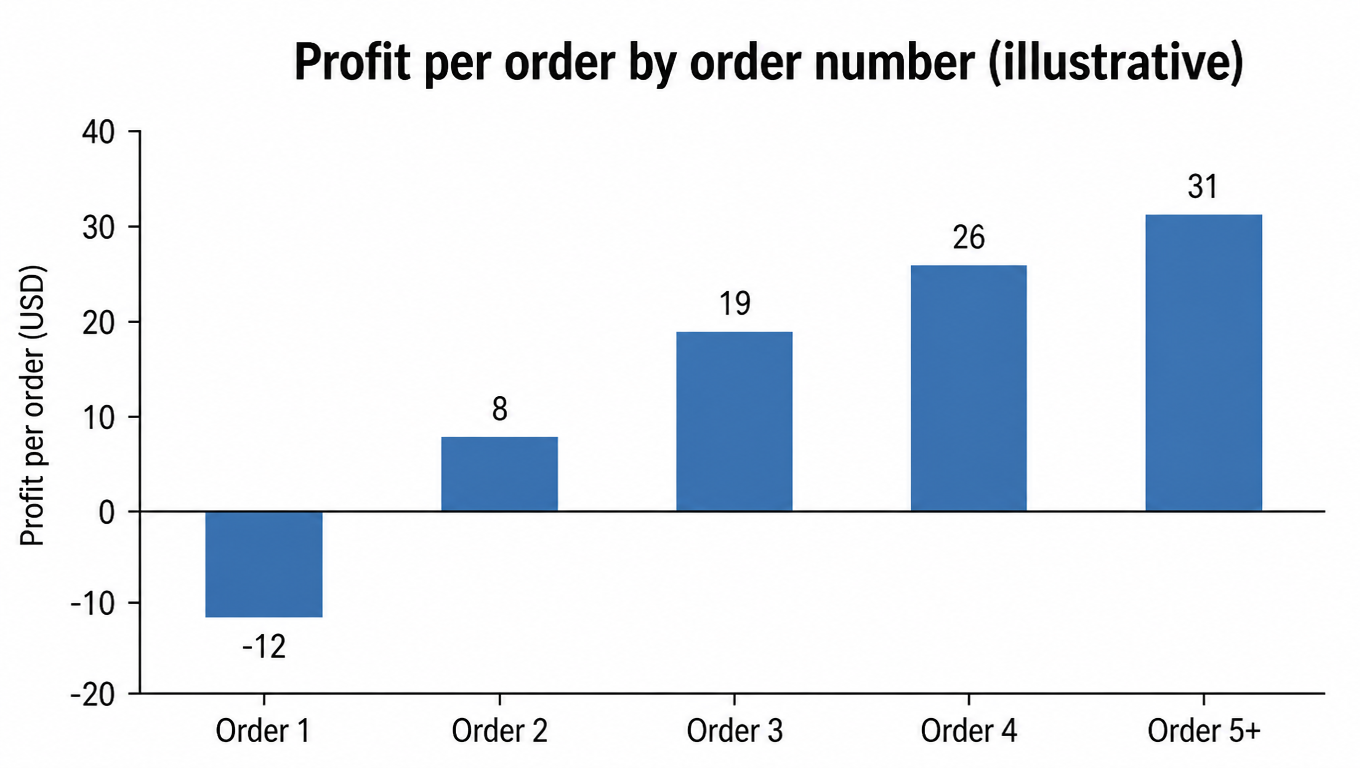
Bar chart: profit per order by order number, order 1 at -12 USD, order 2 at 8, order 3 at 19, order 4 at 26, order 5+ at 31
Profit per order steepens sharply after order one; the repeat purchase lever dwarfs the freight lever

Consider a composite example we will return to throughout this article. A DTC brand, mid-size, shipping a few thousand orders a month, switched to a carrier that was 18% cheaper per shipment to protect margin in a promo-heavy quarter. Six months later, repeat purchase rate among new customers had dropped nine percentage points. The freight savings were real and visible. The lost repeat revenue never appeared on any report, because nobody was measuring it.

The Damage Side: How Slow or Unpredictable Delivery Erodes Repeat Purchases

The delivery moment is a moment of truth. When a package arrives on time and intact, the brand's promise is confirmed and the customer moves on happy. When it arrives late, lost, or damaged, the customer silently re-decides whether to trust you. That re-decision is especially dangerous on the first order, because the customer has nothing else to anchor on yet. The first delivery is not just a delivery; it is the first proof of whether the brand keeps its word.

The industry research points the same direction. Dotcom Distribution's widely cited survey found that 87% of online shoppers treat shipping speed as a key factor in their decision to shop with a retailer [^1]. Ipsos found that 85% of online shoppers say a poor delivery experience would prevent them from ordering from that retailer again [^2], and Narvar's research found that after a single bad delivery experience, a majority of younger shoppers say they will not shop with that retailer again [^3]. The direction is consistent across studies: delivery failure is a retention event, not a logistics footnote.

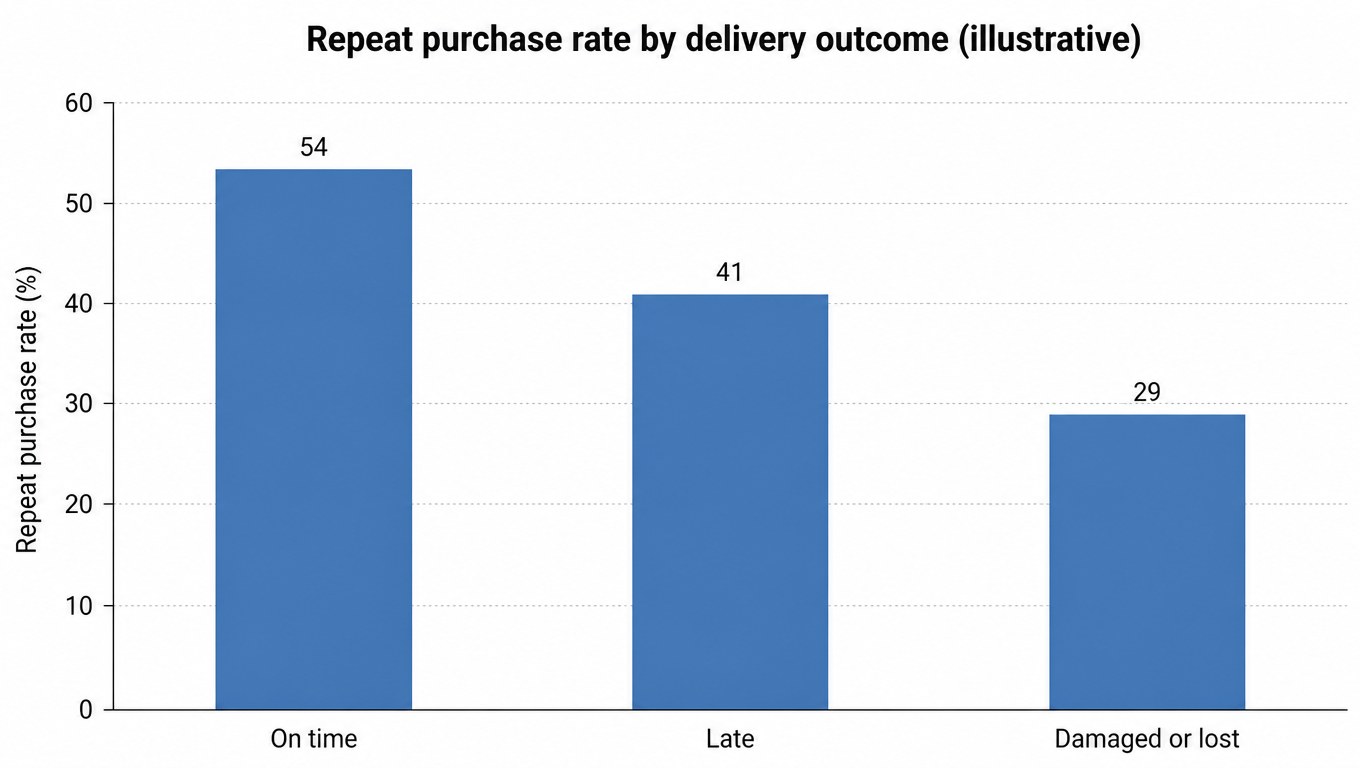
Bar chart: repeat purchase rate by delivery outcome, on time 54%, late 41%, damaged or lost 29%
Repeat purchase rate splits sharply between on-time, late, and damaged-or-lost deliveries

Here is what that looked like in our composite fashion brand. To hold margin, they moved from a reliable national carrier to the cheapest option available. On-time percentage slid from around 96% to around 88%, and \"where is my order\" tickets roughly tripled. Within two quarters, repeat purchase rate among new customers had dropped by nine points, refunds and chargebacks crept up, and support tickets about lost or damaged packages started showing up in the review stream. The per-order savings were smaller than the combined losses. The brand saved on every shipment and paid for it many times over in the cohort report.

Customer checks an empty mailbox on a rainy night while reading a delivery delay update.
A late delivery is the moment a customer silently re-decides whether to trust you

The hidden costs compound. A late package triggers a refund request or a chargeback, which costs the goods, the shipping, and the fees. It generates support tickets, which cost labor. It produces negative reviews and word of mouth, which raise acquisition costs for everyone who follows. One bad delivery event can cascade through several cost lines while the freight savings stay a single, tidy line item.

And speed alone is not the answer. A carrier that is two days slower but reliable, with tracking that matches reality and a delivery window you can actually promise, often outperforms a fast carrier that overpromises and underdelivers. What customers punish is not slowness; it is the gap between what you promised and what happened. That promised-versus-actual gap is the single most useful logistics signal for repeat purchase analysis, and we will make it a first-class field in the measurement framework below.

The Recovery Side: Brands That Turned Delivery into a Repeat-Purchase Engine

The canonical example is Zappos. The company built its brand on free two-way shipping, surprise overnight upgrades, and a returns policy so generous it became marketing. Delivery was deliberately treated as an investment in loyalty, not a cost to minimize. The result, widely reported at the time and still cited today, is that around 75% of Zappos orders came from repeat customers [^4]. The shipping budget and the repeat purchase rate were two ends of the same strategy.

Amazon Prime is the bigger version of the same idea. Free two-day shipping, bundled into a membership, changed buying frequency at the category level. Prime members shop more often and spend significantly more per year than non-members (about $1,170 versus $570 in 2024, per CIRP) [^5], and the membership itself creates a reason to consolidate purchases with one retailer. Whether you admire the moat or resent it, Prime is the proof that delivery speed, priced into the offer rather than cut to the bone, is a retention engine.

The same logic works at a smaller scale. In our second composite case, a subscription and consumables brand (replenishment products in a few dense metro markets) switched from a single national carrier to regional carriers plus scheduled delivery windows. Average delivery time improved, exceptions dropped sharply, and both repeat purchase rate and customer lifetime value moved up over the following quarters. They did not need to be Amazon; they needed to be more predictable than their own previous quarter.

Free shipping thresholds deserve their own mention because they pull two levers at once. Raising the threshold nudges average order value up, and free shipping itself removes a friction point that customers remember at the next purchase decision. Many stores run this as a controlled test and watch both AOV and repeat purchase rate move together. The pattern across all of these examples is the same: winners treat delivery as a product feature, priced into the offer, while losers treat it as an accounting line to cut.

Hands open a parcel containing a handwritten thank-you card.
The unboxing is the first proof of the brand promise and the first psychological brick of the repeat purchase

The Measurement Framework: From Shipping Cost to Repeat Purchase Rate

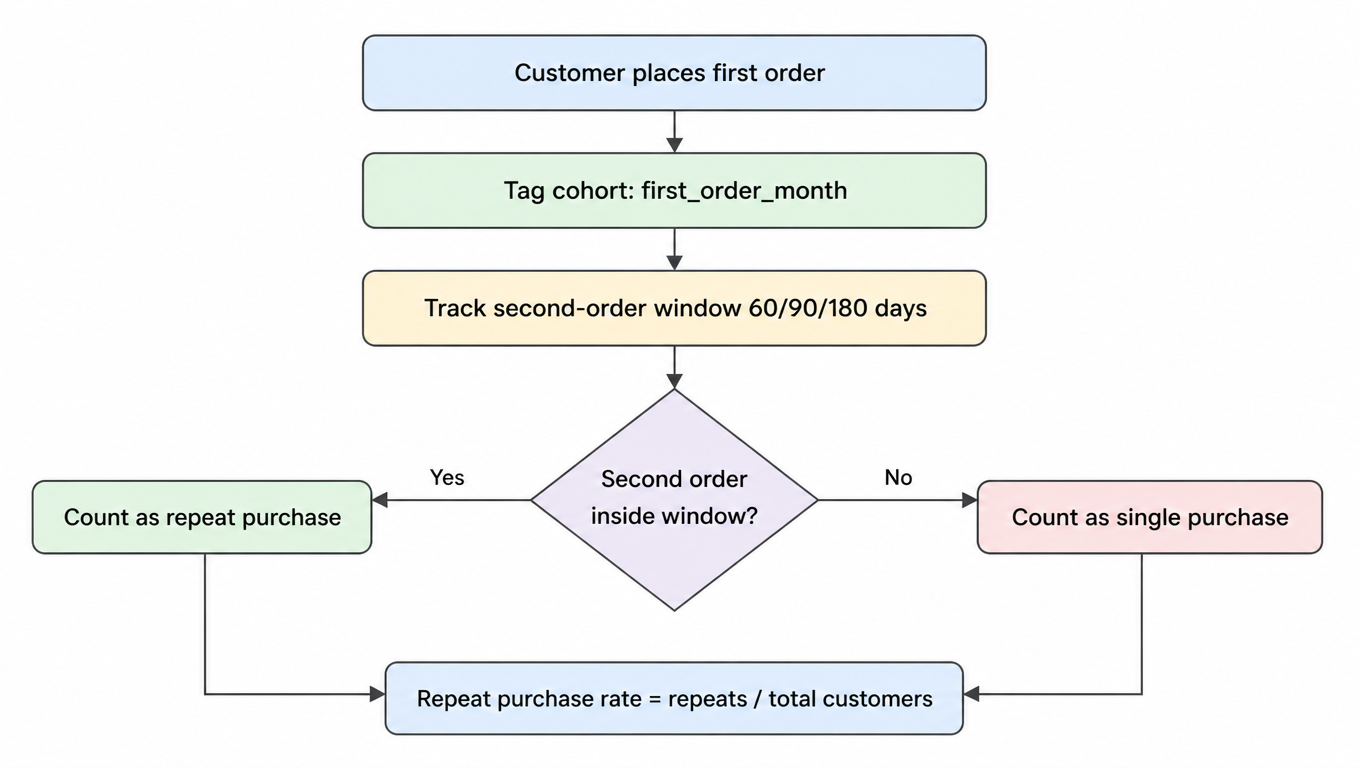
The core metric is simple: repeat purchase rate equals the number of customers who placed two or more orders within a window, divided by the total number of customers in the cohort. The rigor lives in the cohort definition and the window, not in the arithmetic.

Build the cohort framework first. Tag every customer with a first_order_month the moment they place their first order, and attribute every later order back to that cohort. Then define the second-order window you care about: 60 days, 90 days, or 180 days after the first order. A customer who orders again inside the window counts as a repeat purchase; one who orders later does not. Always compare cohorts of the same age: the January cohort at day 90 against the February cohort at day 90, never a January cohort against a July cohort, because seasonality will masquerade as a logistics effect.

Flowchart: customer places first order, tag cohort (first order month), track second-order window 60/90/180 days, second order inside window counts as repeat purchase, otherwise single purchase, repeat purchase rate equals repeats divided by total customers
The cohort framework: tag by first order month, judge repeat purchases inside the 60/90/180 day window

Then build the order-level dataset. One row per order, with these fields:

  • customer_id: the join key to the customer record and its first_order_month cohort.
  • carrier: the carrier that actually shipped the order.
  • service: the service level purchased, for example First-Class, Ground, or Overnight.
  • promised_vs_actual: promised delivery date or window versus the actual delivery date, in days or as an on-time flag.
  • exception: a flag for delayed, lost, or damaged orders, ideally with the exception type.
  • shipping_cost: what the order actually cost to ship, and whether the customer paid for shipping or it was free.
  • second_order_window: days from first order to this order, used to decide whether it falls inside the window.

Here is the data reality you will hit. Ecommerce platforms record \"delivered\" but almost never record \"on time.\" You cannot compute promised-versus-actual from the platform alone; you need carrier tracking events, carrier API lookups, or 3PL reports to fill the gap. Exception flags live in carrier scan data, not in your order export. Budget for a small data-joining exercise, because the promised-versus-actual field is the most predictive one in the whole framework, and it is the one most stores do not have.

Finally, control the confounders. Repeat purchase rate responds to many things that have nothing to do with shipping: acquisition channel (a paid social buyer and an organic buyer repeat very differently), product mix, order value bands, and seasonality. When you compare delivery outcomes, compare within the same channel, the same product or category bucket, the same AOV band, and the same season. Combine cohorts, segmentation, and deliberately controlled changes (change one logistics variable at a time) so that what you measure is the logistics effect, not the noise around it.

The Playbook: Measuring It in Your Own Store, Step by Step

Step 1: export orders and tracking data. Pull your order history from Shopify admin or its API, your tracking events from the carrier portals or APIs, and delivery reports from your 3PL if you use one. You need four things joined together: order records, customer records, tracking events, and shipping cost.

Step 2: tag every order with the logistics fields. Build the one-row-per-order table from Section 4: carrier, service, promised versus actual, exception, shipping cost. This step is usually a spreadsheet join or a small SQL query, and it is where 80% of the effort goes the first time. It gets cheap once the pipeline exists.

Step 3: join to customers and build cohorts. Tag each customer with first_order_month, then compute repeat purchase rate per cohort at the 60, 90, and 180 day windows. You now have the baseline: how repeat purchase behaves when nothing changes.

Step 4: segment by logistics variables and run controlled changes. Compare repeat purchase rate across carriers, service levels, on-time versus late, and excepted versus clean orders, holding channel, product, AOV, and season fixed. Then change one thing deliberately: a free shipping threshold, a carrier switch, a service-level downgrade, and watch the cohort curves for the group that changed.

Step 5: convert to money. Take the repeat purchase rate difference you can attribute to a logistics variable, multiply by the cohort size, then by average order value and gross margin, and you get the repeat revenue at stake. That number is what you take to the finance team when you argue for a better carrier or a faster service level.

The tooling ladder starts low. A spreadsheet handles a few thousand orders; SQL or a BI tool handles tens of thousands; dedicated retention analytics tools handle cohort building and segmentation out of the box. Small teams can complete Step 1 through Step 3 this week with nothing more than an export and a pivot table.

Reading the Results and Deciding What to Do

Before you panic, know the base rates. Repeat purchase benchmarks vary wildly by category: consumables and subscriptions sit far above high-consideration purchases like furniture or large appliances. DTC brands in replenishment categories can see repeat rates in the 30% to 45% range, apparel runs 20% to 32%, and home goods often land below 18% [^6]. Compare yourself to your own cohorts first, and to your category second.

Small movements matter at scale. A 2-point lift in repeat purchase rate on a customer base of 10,000 is 200 extra second orders, and at a $60 average order value that is $12,000 in revenue with no acquisition cost attached. The same math runs in reverse: a 2-point drop is money leaving through a door nobody watches.

Watch for the red flag pattern. In cohort charts, the tell is a cohort that tracks fine for the first 30 to 60 days and then bends downward at the 60 to 90 day mark. That bend is where late or excepted first orders catch up with the customer's second-purchase decision. When you see it, slice that cohort by delivery outcome, and the logistics effect usually shows up as a clean split between on-time and problematic orders.

Then make the call with a simple decision framework. If cohorts with logistics exceptions show measurably lower repeat purchase, and the split holds after controlling for channel, product, AOV, and season, you have a shipping problem with a dollar value attached. That is the moment to invest in a faster or more reliable carrier, a regional carrier mix, a better 3PL, or scheduled delivery. If the cohorts look clean and repeat purchase is still weak, the constraint is product or offer, and no carrier upgrade will fix it. The framework's job is to tell those two cases apart instead of guessing.

Shipping is a retention investment with a measurable return, but only if you build the measurement. This quarter, do three things: build the one-row-per-order table with the fields from Section 4, compute cohort repeat purchase rates at 60 and 90 days, and segment by delivery outcome with the confounders controlled. The first pass will be imperfect, and it will already be more than almost every competitor is doing. The second order is where the money is, and delivery is the lever you have been ignoring.

FAQ

Repeat purchase rate equals customers who placed two or more orders within the window divided by total customers in the cohort. Tag each customer with first_order_month at their first order, and attribute every later order back to that cohort. Choose the window by category: 60 or 90 days for consumables and subscriptions, 180 days for high-ticket, low-frequency categories. A second order inside the window counts; one after it does not. Always compare same-age cohorts (January at day 90 against February at day 90) so seasonality never masquerades as a logistics effect.
One row per order with seven fields: customer_id (the join key to the cohort), carrier, service (First-Class, Ground, or Overnight), promised_vs_actual (promised versus actual delivery), exception (delayed, lost, or damaged flag), shipping_cost (including whether it was free), and second_order_window (days from first order). Platforms record \"delivered\" but not \"on time,\" so promised-versus-actual must be filled from carrier tracking events, carrier APIs, or 3PL reports. It is the most predictive field in the framework and the one most stores are missing.
Repeat purchase rate responds to acquisition channel, product mix, order value bands, and seasonality. When comparing delivery outcomes, compare within the same channel, the same product or category bucket, the same AOV band, and the same season. Combine cohorts, segmentation, and controlled changes that alter one logistics variable at a time, so you measure the net logistics effect instead of the noise around it.
The tell is a cohort that tracks fine for the first 30 to 60 days and then bends downward at the 60 to 90 day mark. That bend is where late or excepted first orders catch up with the customer's second-purchase decision. Slice the cohort by delivery outcome, and the logistics effect usually shows up as a clean split between on-time and problematic orders.
Multiply the repeat purchase rate difference attributable to a logistics variable by cohort size, average order value, and gross margin, and you get the repeat revenue at stake. If exception cohorts show measurably lower repeat purchase and the split holds after controlling confounders, invest in a faster or more reliable carrier, a regional carrier mix, a better 3PL, or scheduled delivery. If the cohorts look clean and repeat purchase is still weak, the constraint is product or offer, and no carrier upgrade will fix it.

Want your repeat purchase analysis grounded in trustworthy shipping data?

EasyShippingX operates in the carrier execution layer (rates, labels, tracking). Your analytics team decides how to define cohorts, windows, and repeat purchase; EasyShippingX makes sure carrier selection, promised-versus-actual, and exception events flow back accurately and in near real time, so the fields that power your repeat purchase analysis are real data, never guesses.