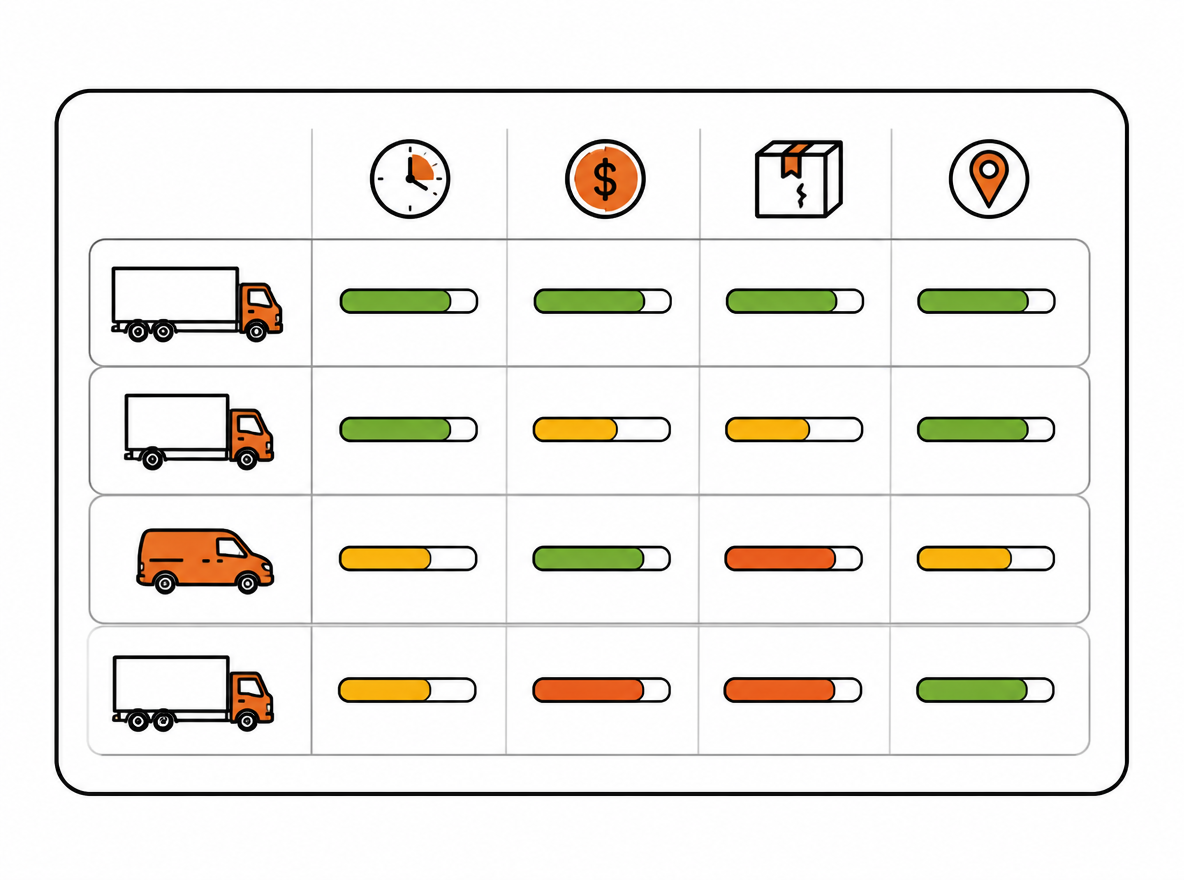
Performance Benchmarking and Governance

Carrier Performance Benchmarking Workflow: A 7-Day Implementation Playbook

This workflow is for carrier managers, operations leaders, and analysts who own a carrier mix. It does not ask which carrier has the highest overall score. It asks whether a difference remains meaningful within comparable lanes, service promises, and package profiles—and whether the evidence justifies investigation, negotiation, or a controlled volume test.

Define the decision before the scorecard

One scorecard should not simultaneously decide carrier replacement, daily exception handling, and contract renewal. Write down the decision, observation window, and decision owner first. Otherwise, a temporary fluctuation can be mistaken for a structural problem.

Use the multi-carrier strategy overview to define which routing decision the measurement supports. The carrier performance scorecard helps turn comparable tracking and billing records into an ongoing review.

DecisionEvidence neededDo not infer directly
Operational investigationA repeatable gap within a lane or exception typeImmediate network-wide volume reduction
Contract negotiationTrend, billing, and root-cause records under stable definitionsReplacing contract terms with one composite score
Volume reallocationComparable cohorts, sufficient observations, backup capacity, and rollback planRouting every shipment to the historical winner

Create comparable cohorts before comparing carriers

Carrier performance depends on shipment mix. At minimum, cohort by origin, destination region, service level, package weight or size band, promise-date definition, and reporting period. Direct comparison is appropriate only where carriers served genuinely similar shipment profiles.

  • Flag promotion peaks, weather events, and warehouse outages instead of silently blending them into the normal baseline.
  • Predefine how cancellations, test orders, customer address changes, refusals, and missing data are treated.
  • Small cohorts should display sample size and an insufficient-evidence state instead of forcing a ranking.

Write a measurement contract for every KPI

A metric name is not a metric definition. Record the numerator, denominator, start and end timestamps, exclusions, data source, owner, and refresh cadence for each KPI. The five measures below are a starting set; whether they belong in a composite score depends on the decision.

MetricWorking definitionCritical boundary
On-time delivery rateEligible parcels delivered by the customer promise / eligible parcelsCarrier ETA does not automatically equal the customer promise
Transit timeDistribution from the agreed first valid event to deliveryReview median and tail behavior, not only the mean
Exception rateParcels with a defined exception / observable parcelsDamage, loss, address, and customs issues stay separate
Final cost per shipmentReconciled transportation charges / settled parcels in the cohortQuote, label charge, and final invoice are not interchangeable
Shipping contact rateVerified shipping-related contact orders / eligible ordersSeparate carrier, promise, and notification causes

Write every KPI as a reproducible formula

On-time deliveryOTD = ndelivered by promise ÷ neligible

Define denominator exclusions and fix the source and time zone of the customer promise.

Transit timeTransiti = tdelivered − tagreed start

Calculate per parcel, then show median, P90, and sample size by cohort; the mean cannot replace tail performance.

Exception rateER = ndefined exception ÷ nobservable

Keep exception category and responsibility instead of collapsing every failure into one unactionable ratio.

Final cost per shipmentCPS = Σ(base + fees + allocated exception cost) ÷ nsettled

Use the same settlement window for numerator and denominator; disclose unsettled parcels separately.

Shipping contact rateSCR = nverified shipping-contact orders ÷ neligible orders

Deduplicate by order and retain carrier, warehouse-promise, notification, and customer causes so support tagging quality is not mistaken for carrier performance.

Pass a data-quality gate before ranking

  1. Use an internal shipment ID as the key and retain order number, all tracking numbers, and raw carrier events; tracking numbers can change and are not a permanent identity.
  2. Reconcile shipped orders, registered tracking numbers, received events, and billed shipments. Explain gaps before publishing the scorecard.
  3. Show observation count, completeness, and last refresh for every metric. Missing data must not default to good performance.
  4. Version metric-definition changes. Split the series before and after a change to avoid manufacturing a false trend.

Minimum fields for the first scorecard sheet

Keep carrier, cohort key, reporting window, eligible shipment count, five raw KPIs, sample size and completeness per KPI, target or boundary version, five normalized scores, weights, composite score, exception summary, owner, next action, and review date. Raw values, scores, and actions must remain separate columns.

Treat the scorecard as an index, not a verdict

A composite score is useful for locating cohorts that need drill-down; it should not replace judgment. Weights, targets, and tolerance bands should reflect service promises, cost goals, and risk appetite. Illustrative weights can support a first rehearsal, but they are not an industry standard.

Higher is betterSi = min(100, 100 × xi ÷ Ti)

Use only for ratio metrics with a meaningful zero and roughly linear value below target. Cap at target so overperformance cannot offset failures without limit.

Lower is betterSi = 100 × clamp((Ui − xi) ÷ (Ui − Bi), 0, 1)

B is the best boundary and U the tolerable upper bound, where U > B. Set and version both before viewing results.

Composite scoreS = Σ(wi × Si),   Σwi = 1

Use the composite to prioritize drill-down. Safety, compliance, and critical service failures remain non-compensating gates.

Weight coverageC = Σ(wi × Ii)

I=1 when a KPI is publishable, otherwise 0. Suppress the composite when completeness fails; do not silently redistribute missing weights.

Preserve the original template as rehearsal weights—not a standard

On-timeExceptionsTransitFinal costContacts
30%25%15%15%15%

For example, if a comparable cohort has normalized scores of 96, 82, 75, 88, and 90, the rehearsal composite is 96×30% + 82×25% + 75×15% + 88×15% + 90×15% = 87.25. It only prioritizes investigation under the agreed weights; it does not prove that an 87.25 carrier fits every lane.

  • Display raw metric, target gap, trend, sample size, and composite score together.
  • Set non-compensating guardrails for safety, compliance, or critical service failures.
  • Review weights on a schedule; do not change them after seeing results to justify a preferred conclusion.

Make uncertainty explicit when comparing rates

Simple diagnostic intervalΔ = pA − pB
SE(Δ) = √(pA(1−pA)/nA + pB(1−pB)/nB)
Approx. 95% interval = Δ ± 1.96 × SE(Δ)

This is a screening approximation when the two sets of observations are roughly independent. If parcels cluster by warehouse, day, lane, or batch—or assignment was not random—use stratified, cluster-robust analysis or a controlled test. The interval is not an automatic carrier-switch rule.

Turn weekly review into a controlled decision loop

The scorecard detects signals; every volume change still needs validation and rollback design.
12345
Detect gapValidate dataLocate cohort and causeRun controlled testScale, adjust, or roll back

Meeting timing and cadence depend on the operation. A stable agenda matters more than a prescribed weekday: confirm data completeness, review anomalous cohorts, assign actions with owners and due dates, and record the next check.

From signal to reallocation: four decision levels

LevelActionEntry condition
ObserveFlag trend; keep routing unchangedSingle-period gap or insufficient evidence
InvestigateValidate events, billing, and responsibilityRepeated gap in a comparable cohort
Corrective planAgree actions, owners, and review window with the carrierCause is understood and correctable
Controlled reallocationMove a defined cohort with stop conditionsBackup capacity, risk, and rollback are validated

Score thresholds, consecutive periods, and test sizes must be calibrated to the operation and its risk. There is no universal 60-point, three-week, or fixed-volume rule. Automated actions need human review, an exposure cap, and rollback conditions.

Seven-day implementation plan

DayDeliverableAcceptance question
1Decision statement and ownerWhich specific decision will the scorecard support?
2Comparable-cohort rulesDid the carriers serve similar shipments?
3KPI measurement contractsCan another analyst reproduce the result?
4Shipment, event, exception, and charge tablesCan every record be traced by internal shipment ID?
5Quality checks and first scorecardAre missing and small-sample states visible?
6One rehearsal reviewCan the team move from signal to testable action?
7Publishing cadence, escalation path, and change logWho approves thresholds and volume changes?

FAQ

There is no universal score. Confirm cohort comparability, data completeness, repeated deviation, and root cause before choosing a corrective plan or controlled reallocation.
No. A spreadsheet or lightweight database can support the first version if shipment, event, exception, and charge data share a stable key. Upgrade based on volume, latency, and maintenance burden.
Because on-time rate can hide cost, exception severity, tail transit time, and missing data. It matters, but only within comparable cohorts and service promises.