USPS Guide

USPS Q3 FY2026 Results: Revenue Up, Losses Narrow. What Shippers Should Expect Next

On August 7, 2026, USPS reported its fiscal 2026 third-quarter results: revenue up 6.1% year over year to $19.94 billion, controllable loss narrowed by $584 million. The headline numbers look good, but the growth was almost entirely price-driven while volume kept shrinking. This article unpacks the real signals in the report and what the 8% surcharge expiry, DDU bidding, the DHL deal, and the cash squeeze mean for shippers.

White delivery van with blue stripes and an open cargo area of parcels on a suburban street at dawn.
The numbers improved, but the improvement is price-driven and cash is the real constraint

1. The headline: better, but not a turnaround

USPS reported its fiscal 2026 third-quarter results on August 7, 2026, and the top line moved in the right direction. Operating revenue reached $19.94 billion, up 6.1% year over year[1]. The controllable loss, the non-GAAP measure management tracks, narrowed to $1.04 billion, an improvement of $584 million[1]. The GAAP net loss narrowed by $562 million to $2.51 billion[1]. Total volume was 25.43 billion pieces, up just 0.4% on the recast FY2025 basis the agency adopted with this report[1][2].

The direction is right, but the scale is not yet. Both losses remain large: a $1.04 billion controllable loss and a $2.51 billion GAAP net loss are still far from the breakeven line the Postal Service is required to approach. This is stop-the-bleeding, not a structural turnaround. Revenue is being pulled up by deliberate price policy, while the underlying network still costs more than the mail and parcels moving through it bring in.

The real constraint is cash, not the income statement. This quarter USPS deferred roughly $1.4 billion of FERS normal-cost contributions[1], and it is leaning on regulatory waivers to free up liquidity. That matters for shippers because liquidity pressure is what pushes the next round of rate decisions, network changes, and commercialization moves. The quarterly loss number is the story the press release leads with; the cash position is the story that drives what happens next.
2. Growth was a price story, not a volume story

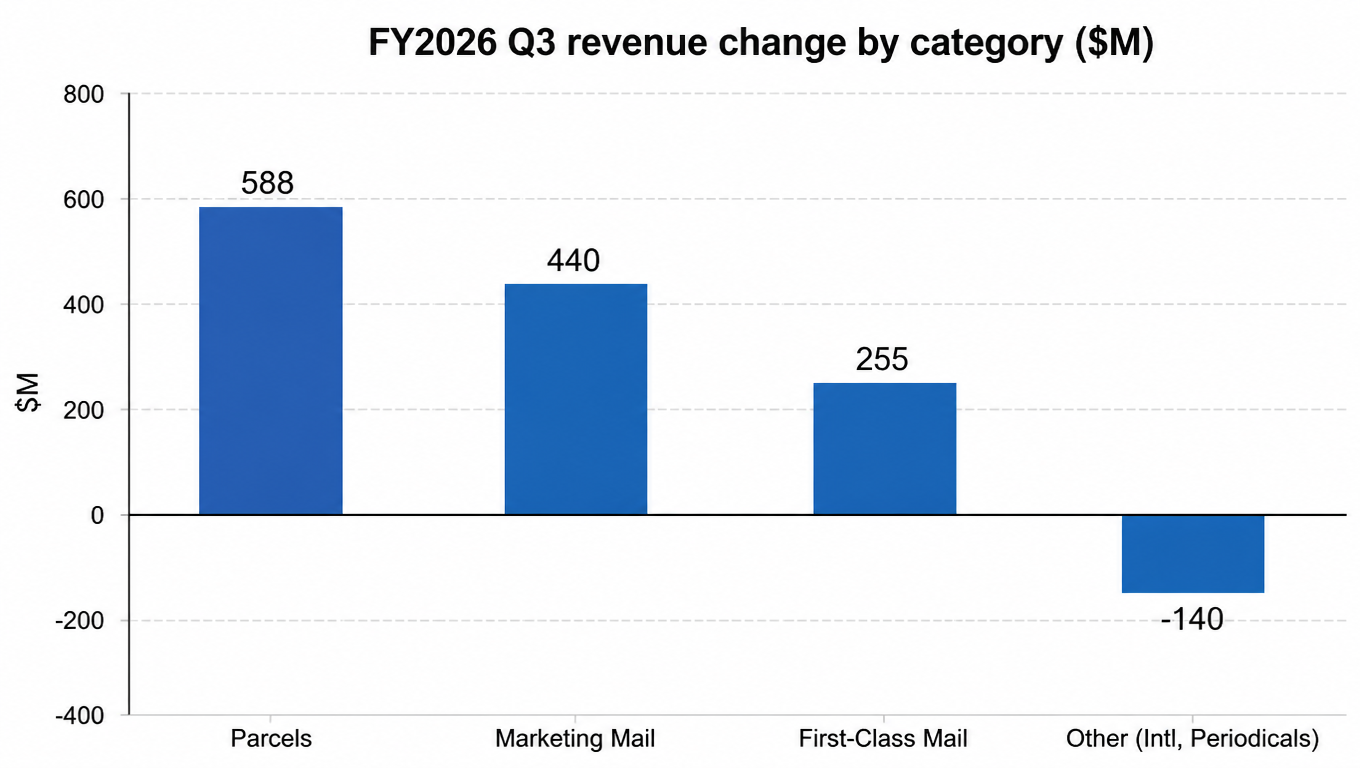
The $1.14 billion net revenue increase came from three categories. Shipping and Packages added $588 million, Marketing Mail added $440 million, and First-Class Mail added $255 million. International, Periodicals, and Other combined to offset $140 million[1]. The category mix tells you where the growth actually came from: parcels, the business everyone watches, led the revenue gain even as its volume fell.

Volume moved in the opposite direction from revenue. Parcels declined 55 million pieces to 1.55 billion, First-Class Mail declined 343 million pieces to 9.46 billion, and only Marketing Mail grew, adding 574 million pieces to reach 13.78 billion[2]. Revenue per piece tells the rest of the story: parcels up 11.5%, First-Class Mail up 8.1%, Marketing Mail up 7.6%, and the blended figure up 5.7% to $0.7842[2]. Revenue per piece is not a pure price measure, it mixes price with product and customer mix, but it is unmistakable evidence that the quarter's growth was engineered through pricing, not demand.

FY2026 Q3 revenue change by category bar chart: parcels +$588M, marketing mail +$440M, First-Class +$255M, other (international, periodicals) -$140M
Revenue growth concentrated in three categories; international and periodicals remain a drag

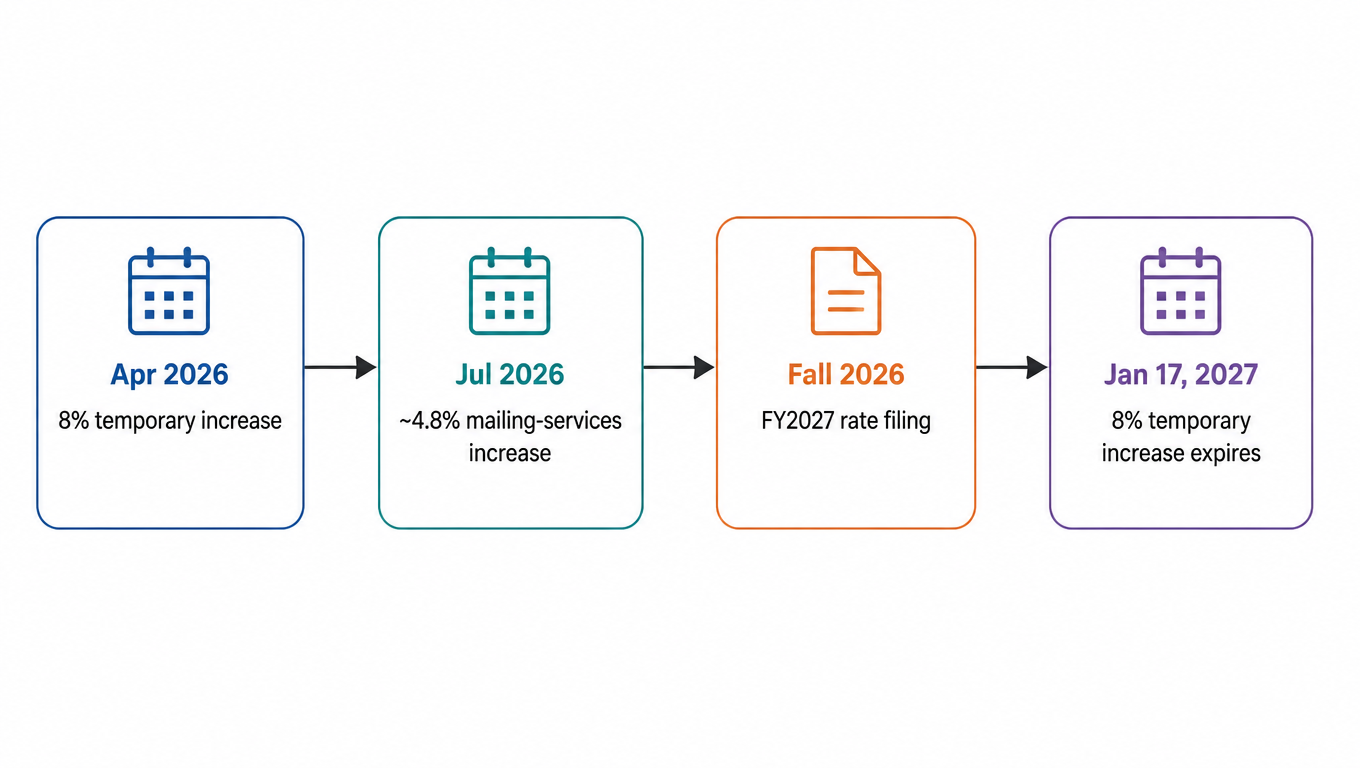
Shippers are already paying for this. The 8% temporary transportation-related increase has been in effect since April 26, 2026 and runs through January 17, 2027[5], and the July 2026 mailing-services increase averaged roughly 4.8% across affected products[6]. Two rate actions inside one fiscal quarter is the stacking effect every budget should account for.

3. Five-year view: revenue held while a sixth of the volume disappeared

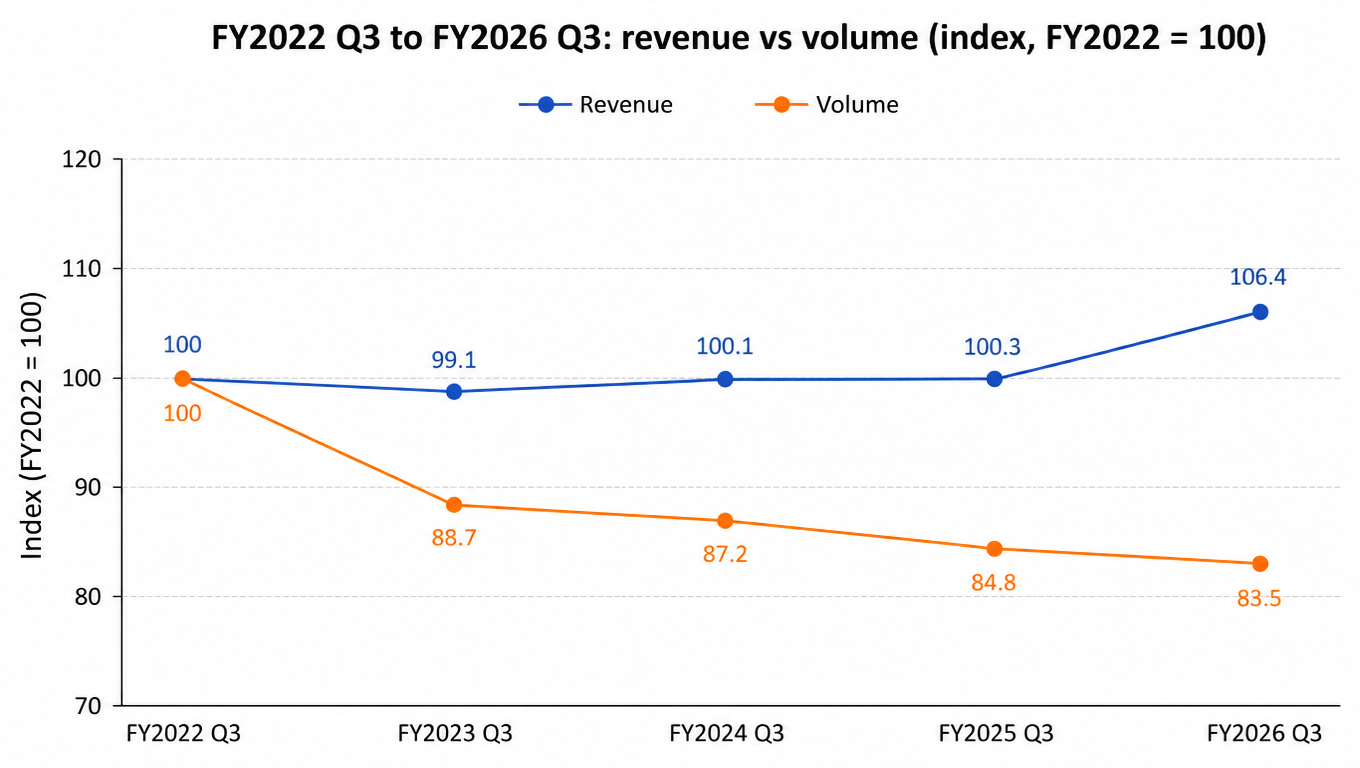
The same-quarter comparison over five years is the starkest frame for this report. Between FY2022 Q3 and FY2026 Q3, revenue went from $18.74 billion to $19.94 billion, a cumulative gain of 6.4%. Volume went from 30.45 billion pieces to 25.43 billion, a decline of 16.5%[1][2], roughly one-sixth of the network's volume gone. Indexed to FY2022 = 100, revenue held near flat at 99.1, 100.1, and 100.3 across FY2023 through FY2025 before jumping to 106.4 this year, while volume slid steadily from 100 to 88.7, 87.2, 84.8, and 83.5. The one aggressive rate year is the only thing that moved revenue; the volume decline never paused.

FY2022 Q3 to FY2026 Q3 revenue vs volume index line chart: revenue 100, 99.1, 100.1, 100.3, 106.4; volume 100, 88.7, 87.2, 84.8, 83.5
Three years of price effort barely held revenue flat while volume kept sliding

The controllable Q3 loss path over the same window shows why the latest improvement deserves a cautious read: $459 million in FY2022, a peak of $1.62 billion in FY2025, and $1.04 billion this year[1]. The FY2026 figure is down 36% from the worst quarter, but it is still 2.3 times the FY2022 level and 1.2 times the FY2023 level. The improvement is real; the base it improved from was terrible.

Two methodological notes belong next to this five-year window. The FY2022 GAAP result is not comparable to later years: it included a roughly $59.6 billion one-time non-cash gain from the Postal Service Reform Act, which is why this article reads the controllable loss instead. And the controllable loss is itself a non-GAAP measure whose exclusions have shifted between years, so the five-year path is directionally reliable rather than perfectly consistent.

Underneath sits a structural tension that pricing cannot solve on its own. The delivery network costs largely do not fall with volume: routes, facilities, and labor are sized to a footprint, not to each quarter's piece count. When volume shrinks and revenue is held up by price, the fixed cost per piece keeps rising[13]. Every future rate increase therefore buys less improvement than the last one.

4. Inside FY2026: seasonality and the cost side

Within the fiscal year, the quarterly path is a familiar seasonal sawtooth on top of a structural deficit. Q1, the holiday peak, produced $350 million of controllable income on $22.24 billion of revenue and 28.35 billion pieces[4]. Q2 swung to a $642 million loss on $20.17 billion and 25.57 billion pieces[3]. Q3 deepened to $1.04 billion on $19.94 billion and 25.43 billion pieces[1][2]. Sequentially, Q3 revenue fell $227 million from Q2, volume fell 146 million pieces, and the controllable result worsened by $396 million. The lesson for anyone reading these reports: compare same-quarter year over year, never sequentially, because peak-quarter profits do not cover the off-peak cost base.

The cost side improved only halfway. Operating expense rose $438 million to $22.5 billion, up 2%[1]. The positive drivers, $1.14 billion of revenue growth and a $416 million decline in workers' compensation expense, were offset by $324 million of higher retirement benefits, $195 million of higher retiree health benefits, $129 million of higher compensation and benefits, and roughly $349 million of other net cost increases. That is why the GAAP net loss improved by only $562 million despite the much larger revenue gain.

Cost discipline is happening, but it is not yet outrunning the structural cost base. USPS cut about 4 million workhours in Q3[1], yet compensation still rose, and fuel pushed transportation and other costs up. The gap between the workhour reductions and the compensation line is the single clearest sign that the fixed-cost network is still the core problem.

5. Four moves USPS makes next

The first is pricing, done differently. Instead of blanket increases, expect tiered, elasticity-aware pricing: higher increases where demand is inelastic, lighter treatment where volume is at risk. The evidence for the elasticity concern is in this very report: parcel volume fell 3.4% after the 8% increase went in[2], even as parcel revenue rose. USPS will price to protect volume where it can and to harvest where it must.

The second is last-mile commercialization. USPS has opened more than 18,000 destination delivery units (DDUs) to shipper bidding, letting high-density drop-shippers access the final mile directly, and it has signed a long-term agreement with DHL eCommerce valued above $10 billion. The figures to watch are not the headline contract totals but the contribution margin, the density of the volume, and the service disclosures that come with these deals.

Workers move parcels along conveyors in a large sorting center.
Network costs do not fall with volume; commercialization and cost discipline must run in parallel

The third is cost discipline, applied more aggressively: tighter shift and route matching, ground-transport substitution for air where service allows, facility consolidation, capital expenditure prioritization, and surcharges on the highest-cost products. Service metrics are the guardrail here, both as a management tool and as a political constraint, because every consolidation invites scrutiny from Congress and mailers.

The fourth is cash preservation, and it is the one that matters most in the near term. The levers already in motion: continued FERS contribution deferrals, a PRC waiver that unlocks roughly $2.4 billion in flexibility, a push to raise the $15 billion statutory debt ceiling that has been unchanged since 1992, CSRS cost reallocation, pension asset diversification, and workers' compensation reform. The caveat that belongs next to all of these: deferrals and borrowing capacity ease liquidity, they do not improve the underlying economics.

USPS rate timeline: Apr 2026 8% temporary increase takes effect, Jul 2026 ~4.8% mailing-services increase, Fall 2026 FY2027 rate filing, Jan 17 2027 8% temporary increase expires
Rate actions keep stacking; next up is a fall filing and a January landing

6. What shippers and 3PLs should do now

Budget for continued price escalation, not relief. The 8% temporary increase expires on January 17, 2027[5], but history argues against a clean rollback: the 2013 exigent surcharge was eventually folded into base rates rather than removed[9][12]. The realistic planning range is another 4% to 8% on USPS parcel products over the next 12 months, with scenario models to match.

Re-run your carrier mix analysis. USPS parcel pricing keeps climbing while its service metrics remain a wildcard, which changes the comparison against regional carriers and UPS and FedEx ground alternatives every quarter. If you have drop-ship density, the DDU bidding program is now large enough, 18,000-plus locations, to be worth a formal evaluation rather than a footnote.

Contract hygiene matters more in a stacking-rate environment. 3PL contracts need explicit price-increase passthrough clauses and dimensional-weight audit rights, because the next round of increases will hit dim-weight parcels hardest. And track two signals in parallel: whether Marketing Mail volume holds, which is the best demand health check available, and how USPS explains the FY2025 volume restatement, which left a roughly 494 million piece gap between the original and recast figures. The FY2027 rate filing this fall[10] and the PRC proceeding on the timing of annual increases[7][8][11] are the two documents that will set the agenda into next year.

Keep a scorecard for the two quarters ahead as well. How much of the $588 million parcel revenue gain came from the temporary 8% increase versus Ground Advantage product and customer mix? When do the DHL and DDU programs start showing up as identifiable revenue and contribution margin, and can they reverse the parcel volume slide? How does USPS plan to pay the deferred FERS and pension obligations, and how much cash and borrowing headroom will it carry into the holiday quarter? And can the workhour and facility cuts keep lowering unit costs without bending on-time performance? Each of those answers will move the rate and mix conversation more than the headline loss number will.

7. Bottom line

The one-line read: USPS is pricing its way toward stability while the network quietly shrinks. The Q3 report is genuine progress, and it is also a warning that the progress is being paid for by shippers through rates, not by the organization through structural reform. Plan for higher rates, stronger alternatives, and a USPS that is increasingly selective about which volume it wants.

Key dates to hold: the 8% temporary increase expires January 17, 2027[5]; the FY2027 rate filing is expected this fall[10]; and the FY2026 Q4 results, the first full look at the holiday season under the new pricing, arrive next. Watch those three markers, and the cash story underneath them, before deciding how much of your parcel mix belongs with USPS.

FAQ

Because the improvement was almost entirely price-driven, not structural: Q3 revenue grew $1.14 billion, parcel revenue per piece rose 11.5%, yet parcel volume fell 55 million pieces. Cash pressure remains (roughly $1.4 billion of FERS contributions deferred this quarter, a push to raise the $15 billion debt ceiling), and liquidity pressure is what drives the next round of rate and network decisions. The $1.04 billion controllable loss is still 2.3 times the FY2022 level; this is not a turnaround.
Most likely not. Historical precedent (the 2013 exigent increase and most COVID-era temporary increases) ended up folded into base rates. Three outcomes are possible: permanent, replaced by a new increase, or removed. USPS has not said which. Budgeting scenarios in the 4% to 8% range is the safer preparation.
Four things: budget scenarios for another 4% to 8% over the next 12 months; re-run cross-carrier comparisons and formally evaluate DDU bidding if you have drop-ship density; review price-increase passthrough clauses and DIM-weight audit rights in contracts; and watch the fall FY2027 rate filing and PRC Docket 140418.
Cash, not the loss. Roughly $1.4 billion of FERS contributions deferred this quarter, a PRC waiver unlocking about $2.4 billion of flexibility, and a debt ceiling still stuck at $15 billion since 1992. The cash position sets the pace of the next rate, network, and commercialization moves, and it predicts rate direction better than the headline loss figure.

Do not want to react only after the next increase lands?

EasyShippingX bakes carrier rate table updates, cross-carrier comparison, and quote pass-through into your shipping flow, so every USPS rate change shows up in your costs and quotes automatically, instead of waiting for you to notice it by hand.