Q4 Fulfillment Strategy · Data-Driven

How to Turn E-commerce Insights into a Stronger Q4 Fulfillment Strategy

Q4 is when e-commerce revenue peaks and fulfillment stress peaks with it. Black Friday weekend can push order volume to three or four times a normal week, and every extra order lands on the same pick lines, the same carrier pickup windows, the same inventory. When something gives, it shows up in one of three ways: a stockout on a bestseller, a delivery that misses its window, or a cost line that blows past the budget.

Here is the uncomfortable part: almost none of those failures is a surprise. The stockout was visible weeks earlier in inventory turns. The delivery delays were visible in a carrier's on-time rate slipping every Friday. The cost overrun was visible in per-order shipping cost creeping up. The data was all there, scattered across the platform backend, the ERP, and the 3PL's reports, and nobody had put it in one place.

This guide turns that scattered data into a Q4 plan: consolidate it into one source of truth, read five leading risk signals, turn last year's Q4 into a risk register, lock capacity in September, set guardrails, monitor live during peak, and review in January so next year starts from data instead of memory.

Operations manager reviews order and warehouse dashboards on three screens beside planning documents.
Peak season does not break operations; invisible data does

1. Why Q4 Fulfillment Breaks Even When Sales Don't

Most operators plan for revenue growth and discover too late that fulfillment never got the same attention. The damage also compounds beyond the quarter. A missed delivery window during Black Friday week produces refunds, chargebacks, and negative reviews that sit on the listing through January. The customers you disappointed in Q4 are the ones who do not come back in Q1. A fulfillment failure in the peak season does not just cost you that order. It costs you next year's baseline.

The good news is that the same data that predicts the failure can prevent it. The rest of this guide is the sequence: one dataset, five signals, a risk register, capacity locked early, guardrails, live monitoring, and a January review.
2. Step 1: Consolidate Scattered Data into One Source of Truth

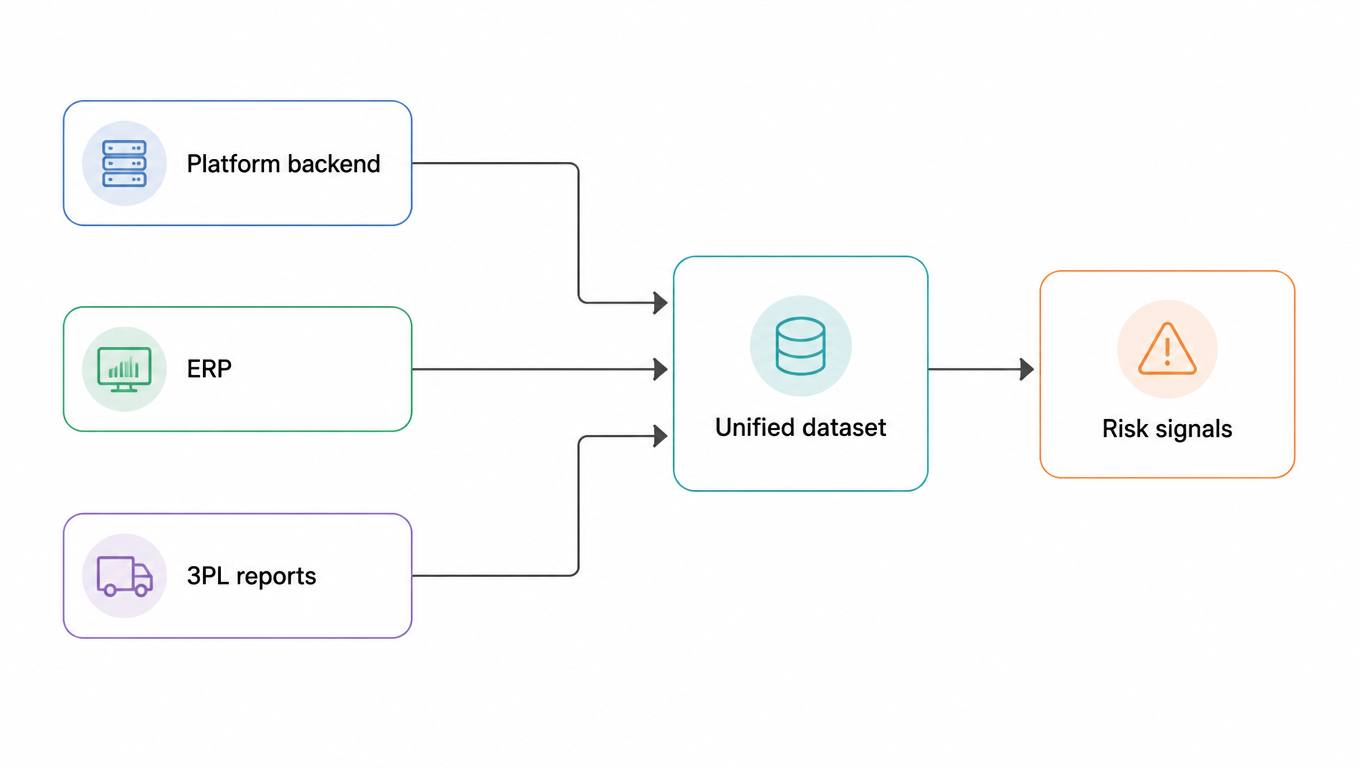
Every Q4 planning conversation should start from one file: a single dataset with one row per order (or per line item) that everyone reads from. Today most sellers keep three separate views. The platform backend knows orders, returns, and ratings. The ERP knows inventory, purchase orders, and landed cost. The 3PL reports know pick and pack rates, carrier performance, and warehouse capacity. Each system is strong where the others are blind, which is exactly why none of them alone can predict a Q4 failure.

Build the unified dataset by normalizing a short field list at the same granularity everywhere: order timestamp, SKU, quantity, carrier, ship date, delivered date, return flag, and reason code where available. The golden rule is one line per line item with the same field names in every export. When the platform's "ship date" and the 3PL's "ship date" disagree, that disagreement is itself a risk signal worth investigating before the peak.

Start the cadence early. Consolidate once a month through the year, and by the time Q4 approaches you want at least three months of clean baseline plus last year's Q4. If you are starting from zero in October, three to four weeks of data plus last year's peak is still enough to run the steps below, just with wider error bars.

Data consolidation flow: platform backend, ERP, and 3PL reports feed one unified dataset, which produces risk signals
Each system is strong where the others are blind; only together can they predict a Q4 failure

3. Step 2: Read the Risk Signals Hidden in the Data

Once the data is in one place, read it for five leading indicators. Order velocity versus forecast tells you whether the peak will be bigger than the capacity you budgeted. SKU concentration tells you how fragile that peak is: if the top 20% of SKUs make up most of your volume, one stockout can break the whole season. Carrier on-time performance by lane shows which carriers are already struggling before the surge. Inventory turns and stockout history name the SKUs that run dry first. Return rate anomalies, especially by reason code, flag products whose returns will eat peak capacity.

Thresholds should be relative to your own baseline rather than copied from a benchmark, but a few starting points help. If order velocity runs more than 15% above forecast for two consecutive weeks, revisit carrier and warehouse capacity before the surge arrives. If a top lane's on-time rate dips below about 92%, line up a backup carrier now. If the top 20% of SKUs account for more than 70% of volume, over-order the top ten by a wide margin. If a SKU's weekly return rate jumps more than a couple of points with a reason code you can name, quarantine it and investigate before it floods the returns line.

The purpose of thresholds is to turn data from a passive record into an active trigger. Review these five indicators monthly through the year, every two weeks in October, and weekly from November on. Each review is a decision point: either the metric is inside its band and you do nothing, or it has crossed a threshold and the next section's risk register already has a row for it.

4. Step 3: Turn Last Year's Q4 Lessons into a Risk Register

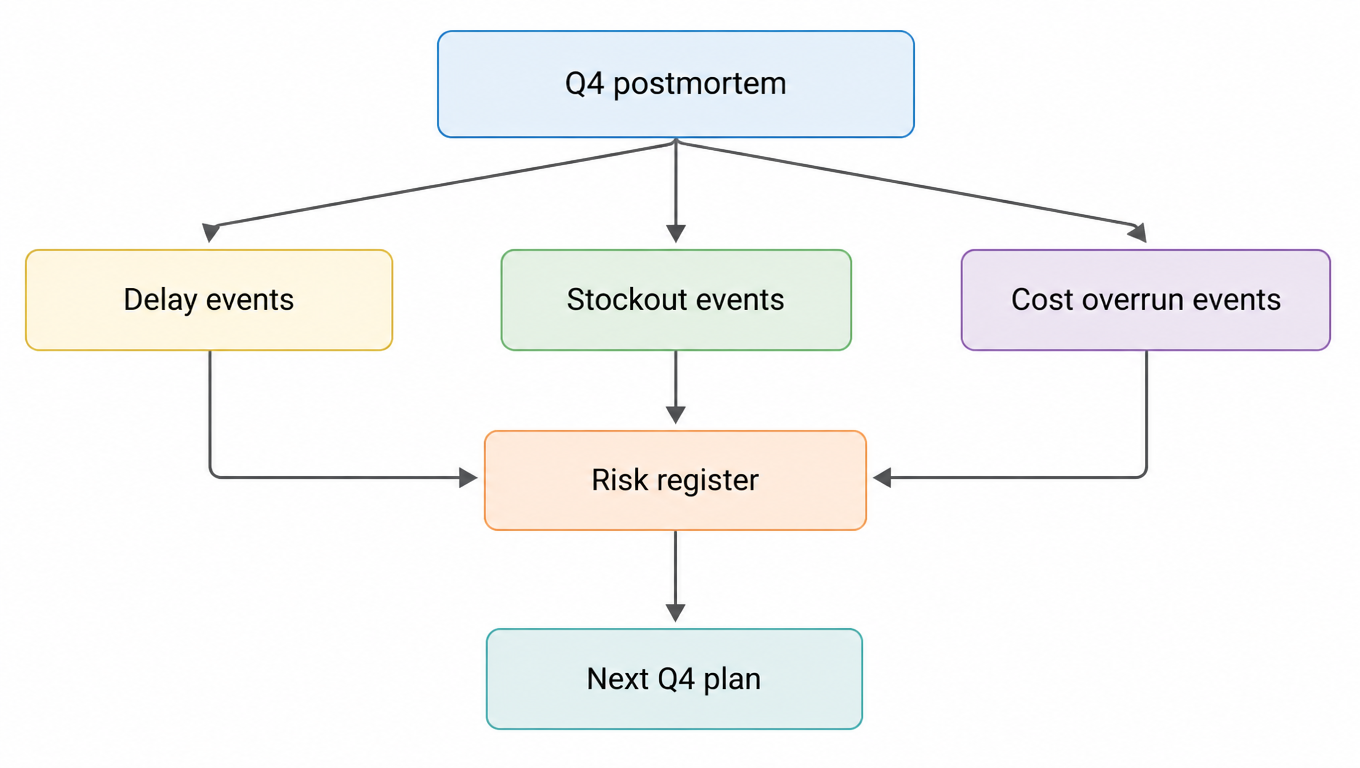
A postmortem built from memory is a story. A postmortem built from data is a plan. Run last year's Q4 through three passes: delay events, stockout events, and cost overrun events. For each event, write four things: what happened, when it happened, which data signal would have predicted it, and the countermeasure this year. That row is one entry in a risk register.

Two examples show how the mapping works. Last November your on-time rate dropped every Friday because orders placed after the carrier's 2 pm cutoff rolled to Monday. The signal was the Friday dip, visible in the on-time data from Step 1. The countermeasure: ship every order placed before noon, and split volume across two carriers so no single cutoff owns the week. Or: your bestseller stocked out on December 10. The signal was a stockout record plus velocity running at twice the forecast for three weeks straight. The countermeasure: pre-buy safety stock in October and raise the reorder point to cover the peak's daily volatility rather than the October average.

Finish with a ranked list of five to eight risks, each with an owner and a trigger. The register is the operating document for the rest of this guide: Step 4 spends money on the risks that matter, Step 5 builds guardrails around them, and Step 6 watches their triggers.

Risk register flow: last year's Q4 postmortem splits into delay, stockout, and cost overrun events, feeding a risk register that outputs next year's Q4 plan
A postmortem built from data is a plan

5. Step 4: Lock Capacity Before the Surge

Capacity talks in October are too late. Start them in September, armed with the consolidated numbers. Carriers price and allocate on volume history, so your Step 1 dataset is your leverage: weekly volume by lane, peak multiples from last year, and the lanes you can move if rates or cutoffs disappoint. Ask explicitly about peak surcharges, pickup cutoffs during the holidays, and Saturday pickup availability. Get the answers in writing, because verbal assurances evaporate on Black Friday week.

The same data drives the 3PL conversation. Use the numbers to negotiate three things: a capacity guarantee for your peak week, extended pick and pack hours, and a returns processing plan for January. A 3PL that sees your October baseline and your BFCM multiple can staff to it; a 3PL that hears "we think it might be busy" cannot. In exchange for firm volume commitments, lock stable pricing now instead of paying peak rates later.

One sentence summarizes the whole step: data is credibility. "We shipped 1,400 orders per week in October and expect 3x in Black Friday week" changes the conversation. "It might be busy" does not.

6. Step 5: Set Guardrails for Peak Operations

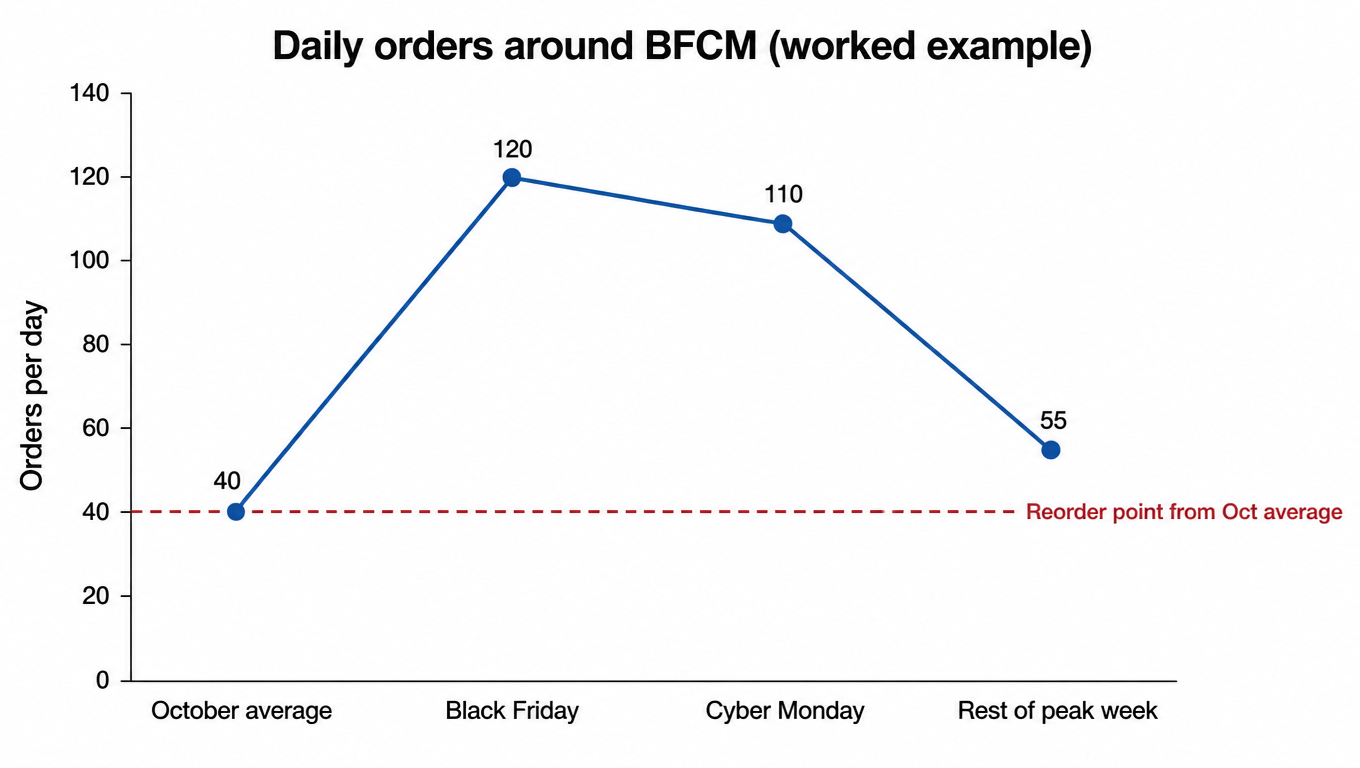
Guardrails are the rules that keep a busy week from becoming a bad one, and they start with replenishment. Set reorder points and safety stock from last year's daily volatility, not from the monthly average, because the monthly average hides the peak. A worked example: one SKU averaged 40 orders per day in October, spiked to 120 on Black Friday and 110 on Cyber Monday, then settled near 55 for the rest of the week. A reorder point built from the October average triggers in the middle of the spike, too late to matter.

Line chart of daily orders around BFCM: October average 40, Black Friday 120, Cyber Monday 110, rest of peak week 55, with the reorder point from the October average marked
A reorder point built on the average triggers in the middle of the spike

Raise the reorder point to cover the peak's worst day, and pre-position the safety stock in the warehouse in October, before the warehouse itself is busy. The same logic applies to cutoffs: publish an order cutoff for standard shipping, keep an expedited lane for late orders that are worth the cost, and decide in advance which orders qualify.

Finally, write the escalation playbook before you need it. Define who decides, who calls the 3PL, who emails customers, and what the message says. When the pick queue exceeds one day or a carrier misses a pickup, the team should execute a pre-agreed sequence, not hold a meeting.

7. Step 6: Monitor Live and Adapt During Q4

During the peak, the five indicators from Step 2 become a weekly dashboard, and daily during Black Friday week: orders versus forecast, picks completed per day versus plan, carrier pickup on time, stockout count, and cost per order. The dashboard exists to trigger decisions, so pair every metric with a pre-committed action. Carrier on-time below threshold on a top lane means shifting volume to the backup carrier, no debate required. Pick queue beyond one day means approving 3PL overtime, budget pre-approved. A top SKU under three days of cover means expediting replenishment, even at a premium.

The discipline that makes this work is deciding the responses before the peak, in the calm of September, not during Black Friday week. When the trigger fires, the team executes a decision that was already made. That is what separates a controlled peak from a fire drill.

The register from Step 3 tells you which metrics deserve daily attention because those are the risks that actually fired last year. Everything else can wait for the weekly review.

8. Close the Loop: A Post-Q4 Review That Feeds Next Year

The last step of Q4 is the first step of next year's plan. Hold the review while the data is fresh, in the first two weeks of January, and record five things: actual weekly volumes, which risks fired and which did not, why the ones that fired were missed or caught, cost per order by week, and what the data said versus what happened. These records become the baseline that next year's Step 1, Step 2, and Step 3 all read from.

The compounding effect is the real payoff. Each year the risk register gets more accurate because it is built on data instead of memory, and each year the thresholds get tighter because they were calibrated against a real peak. Within two or three cycles, the Q4 plan stops being a guess and becomes a forecast with error bars, negotiated in September, monitored daily, and reviewed in January. That is how insights turn into a fulfillment strategy that survives the peak.

FAQ

Start in September, not October. September is when carriers and 3PLs still have capacity to sell, so it is the month to lock rates, cutoffs, and warehouse guarantees. October is for pre-positioning safety stock before the warehouse gets busy. November is for execution and live monitoring. Wait until October and both prices and capacity have already moved.
Run last year's Q4 through three passes: delay events, stockout events, and cost overrun events. For each event record what happened, when it happened, which data signal would have predicted it, and the countermeasure for this year. That mapping, plus a unified dataset with one row per line item, is all you need. If the data is not that granular yet, three to four weeks of data plus last year's peak records is enough to start.
As a starting point, if a top lane's on-time rate dips below about 92%, line up a backup carrier before the surge. Calibrate the threshold to your own baseline and to how much it costs to switch lanes, but the discipline matters more than the number: decide the trigger and the response before peak, not during it. By Black Friday week you have almost no room left to negotiate a switch.
Set reorder points and safety stock from last year's worst peak days, not from the monthly average. In the worked example in this guide, a SKU averaging 40 orders a day in October spiked to 120 on Black Friday; a reorder point built on the October average fires too late. Cover the worst day, and pre-position the stock in October, before the warehouse itself gets busy.
Hold it in the first two weeks of January and record five things: actual weekly volumes, which risks fired and which did not, why the ones that fired were missed or caught, cost per order by week, and what the data said versus what happened. These records become the baseline next year's plan reads from, and year after year the Q4 plan turns from a guess into a forecast with error bars.