Ecommerce Shipping Guide

When Delayed Imports Arrive All at Once: A Parcel Capacity Playbook for Ecommerce Brands and 3PLs

Twelve containers. Three weeks late. All of it hits the dock in three days. That is the scenario this playbook is built around: a brand whose 12 ocean containers were delayed in transit finally clears them, and 80,000 units (roughly 53,000 parcels at 1.5 units per order) arrive within a 72-hour window, while 9,000 backorders are already waiting to ship. The warehouse that normally moves 2,000 parcels a day is suddenly asked to move more than twice that, for a week straight, using the same docks, the same people, and the same carrier pickup appointments. This playbook is written for both sides of the partnership: brands make the allocation and communication decisions, 3PLs execute the receiving, staging, and carrier plan.

Workers scan parcels from three newly opened containers onto a warehouse conveyor.
A delay does not arrive per unit; it arrives as a peak.

The Mental Model: Convert ETA into Daily Parcel Volume, Then Reconcile Against Four Capacities

Here is the mental model that makes this manageable: a shipping delay does not arrive per unit. It arrives as a peak. The delay itself is mostly out of your control; the peak is not. Everything in this playbook is about converting container- and PO-level ETAs into a daily expected parcel volume, then reconciling that curve against four things you do control: label and scan throughput at the warehouse, carrier pickup capacity, the split between primary and backup carriers, and the overflow routing rules that decide where the excess goes. In our example, 80,000 units at 1.5 units per parcel is about 53,000 parcels; the normal outbound rate is 2,000 parcels a day, and with backorder burn-down on top, the curve peaks around 5,500 parcels a day for four days before decaying back toward steady state.

This curve is the input to every downstream decision in this playbook. Inbound receiving is sized against it, carrier pickup is negotiated against it, inventory allocation is budgeted against it, customer communication is timed off it, and cost accounting is measured by how far actual performance deviates from it. If the curve is wrong, every downstream plan is wrong too, so it gets recomputed every time an ETA moves.
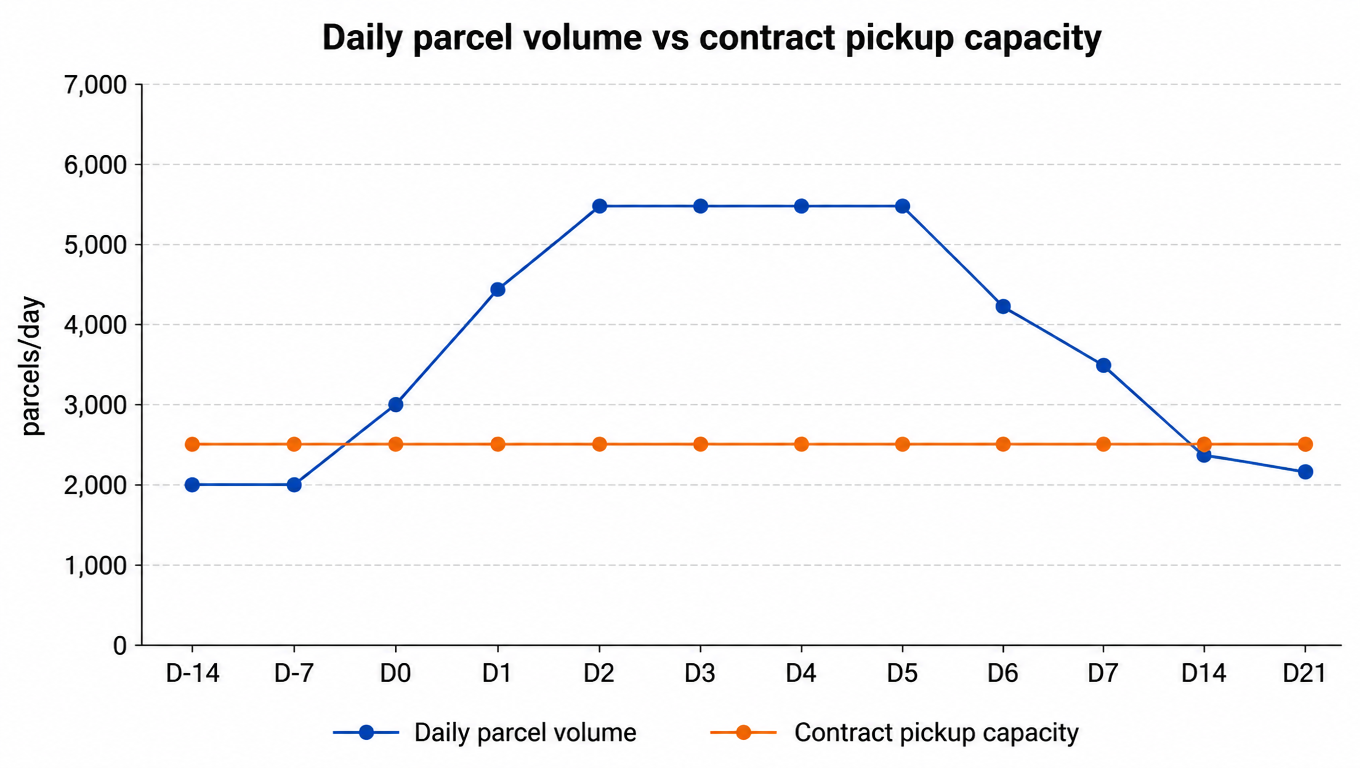
Line chart: daily parcel volume peaks at 5,500 parcels/day after arrival while contract pickup capacity stays flat at 2,500 parcels/day; the gap between the two lines is the capacity gap
Daily parcel volume vs contract pickup capacity: the gap is the entire job.

The Timeline Playbook: Two Weeks Out, Arrival Day, Days 1-7, and After

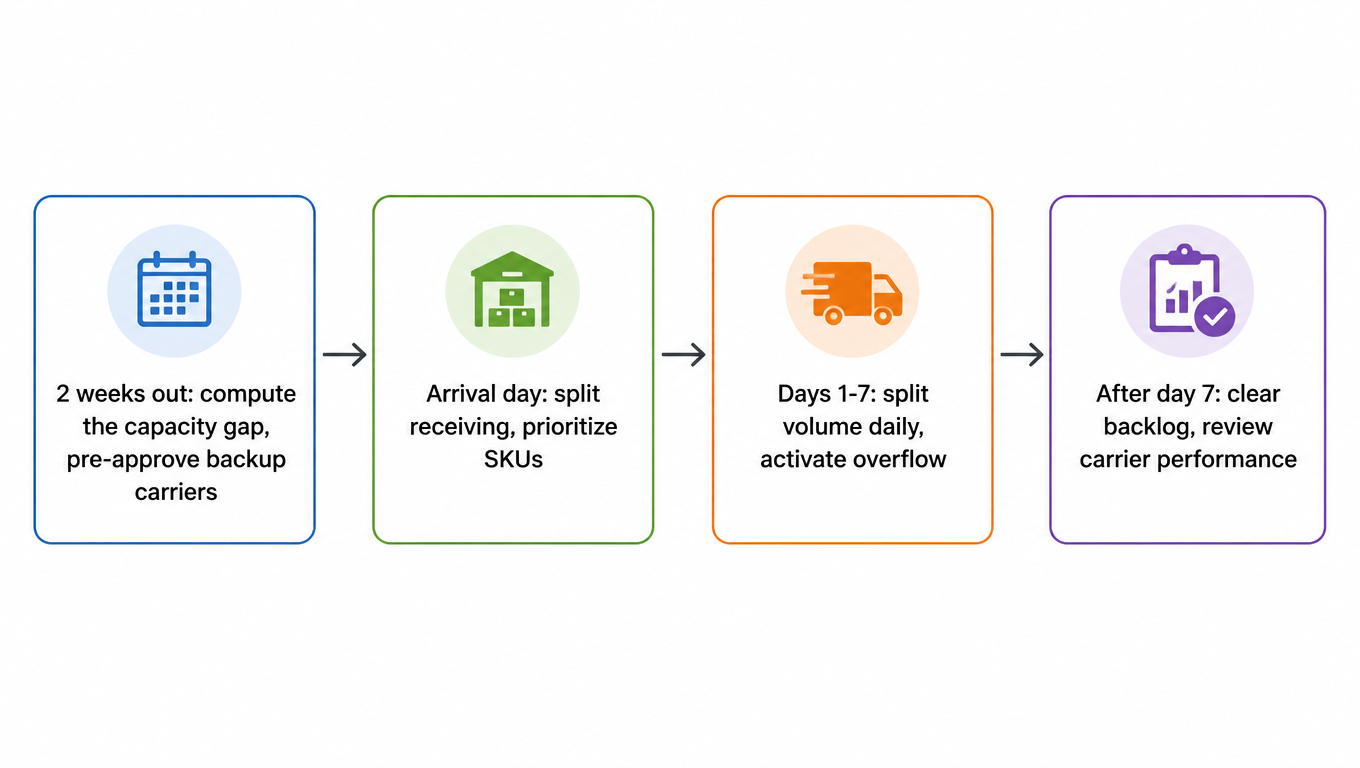
The playbook runs on four phases: two weeks before arrival, arrival day, the seven days after, and the cleanup after that. Each phase has a different owner and a different job.

Flowchart: two weeks out compute the capacity gap and pre-approve backup carriers, arrival day split receiving and prioritize SKUs, days 1-7 split volume daily and activate overflow, after day 7 clear backlog and review carrier performance
Four phases: each has a different owner and a different job.

Two weeks before arrival, the 3PL and the brand run the capacity ledger together: take the peak daily parcel volume from the curve, then compare it against three ceilings, label and scan throughput at current staffing, contracted carrier pickup, and the dock door and labor plan for the arrival window. In our case the peak is 5,500 parcels a day, contracted pickup is 2,500, and normal staffing throughput is 2,800. The gap is roughly 3,000 parcels a day at peak, and that gap is the entire job: surge labor covers part of it, pre-approved backup carriers cover part of it, and overflow routing covers the rest.

On arrival day the 3PL takes over the receiving plan: dock doors are scheduled in slots, containers are split by SKU priority, and the highest-velocity SKUs get scanned first so the first parcels can ship the same day. During the seven days after arrival, the brand and 3PL split the daily volume between primary and backup carriers on a day-by-day basis, and overflow routing activates when a carrier's pickup is full. After day seven the backlog is clear, and both sides review actual carrier performance: on-time percentage, missort rate, and cost per parcel, which feeds the next surge plan.

Scenario A: Sea Freight Delays

Sea freight delays start with ETA drift: blank sailings, port congestion, and transshipment changes push the arrival date out, sometimes repeatedly[1]. The important thing to understand is what drift does to the curve. It does not delete the volume; it shifts the whole daily parcel volume curve to the right, and when the vessel finally arrives, the window compresses. A two-week drift that ends with three days of arrivals is a worse problem than a steady two-week delay, because the peak got taller.

The tactics for Scenario A are all about buying back optionality. Expect partial arrivals: containers on the same vessel do not always clear together, so plan receiving in batches, not in one dock-door event. Ask the freight forwarder for a per-container ETA breakdown rather than a single vessel ETA, and split containers at origin when possible so no single delay holds the whole PO hostage. Reserve carrier pickup with margin: if the curve says 5,500, book capacity for 6,000 on the days you know are spiky, because spot capacity on a port-congestion week is exactly what you cannot buy last-minute[3].

The discipline that makes Scenario A survivable is the daily recompute. Every time an ETA moves, rerun the capacity ledger: new arrival dates, new peak day, new gap. The team that rebooks pickup appointments the morning an ETA slips, rather than the day before the container lands, is the team that never sees an overflow event turn into a service failure.

Scenario B: Customs Holds and Rolling Release

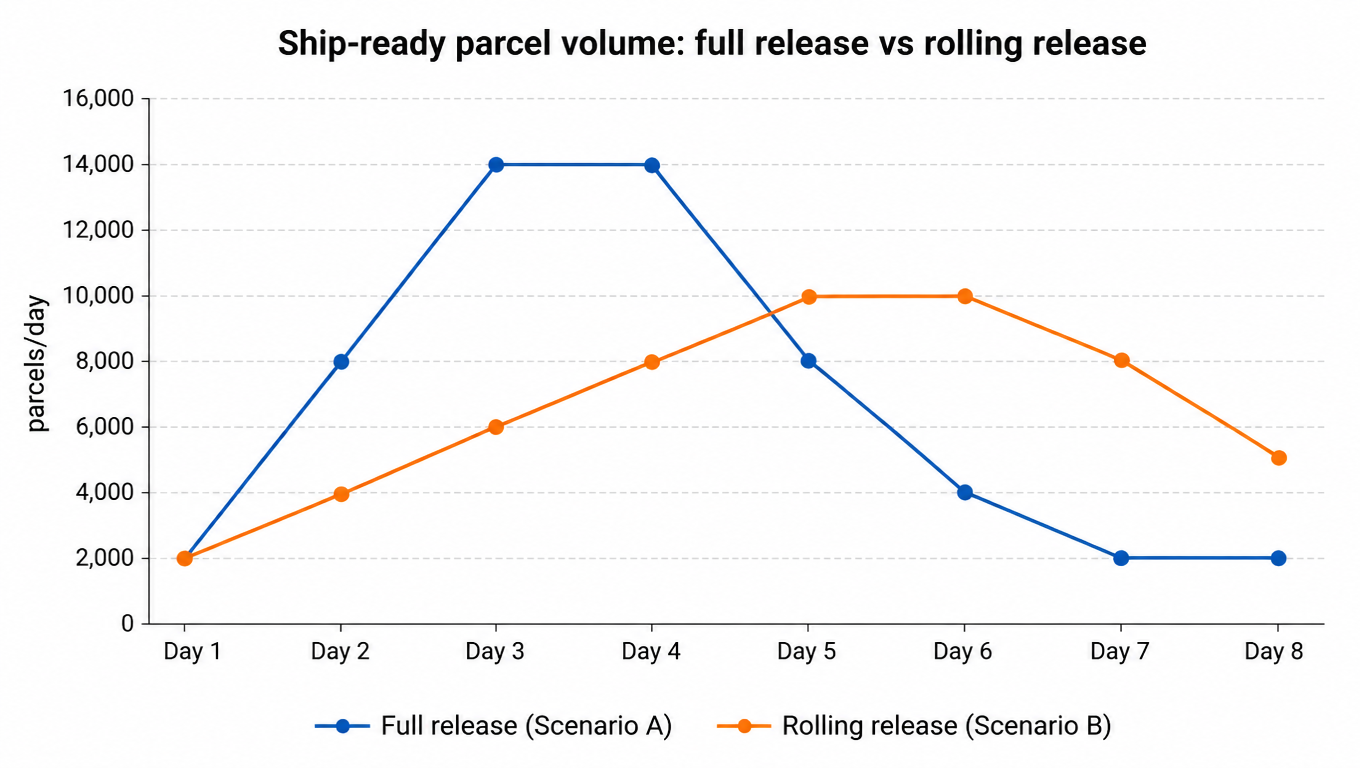
Customs holds are different because the release cadence is largely out of your hands. A hold can come from a routine exam, a missing document, or a classification or value question[2], and the broker's answer rarely arrives as one clean release. It usually arrives in batches: some containers clear, some line items clear, and the rest wait[4]. The curve you plan for is not a spike; it is a ramp that builds over days as each batch is released.

The working structure is a broker communication loop, not a one-off email. Get the broker on a daily status call during the hold window, with a fixed list of questions: which containers are in exam, which line items are flagged, what document is missing, and what the expected release timing is. Turn each answer into a release-notification workflow: the moment a batch clears, the 3PL gets the paperwork, the receiving slot is booked, and the SKUs go to the top of the staging queue. Nothing is worse than inventory that cleared customs but sat in a container for an extra day because nobody told the warehouse.

The second tactic is to prep before release: hold-adjacent SKUs can be staged, labeled, and slotted in advance of the release confirmation, so that the moment the paperwork lands, the receiving event is a formality. And plan for the ramp, not the spike: with rolling release, the daily parcel volume curve is a multi-day slope, so the primary and backup carrier split gets recomputed every day as new batches are confirmed. The same 53,000 parcels that arrive as a three-day wall in Scenario A arrive here as a week-long slope, which is easier on docks and carriers, but only if you actually update the plan each day instead of assuming the hold will end in one release.

Line chart comparing full release spiking to 14,000 parcels/day on day 3 versus rolling release forming a gentler multi-day ramp with a lower peak
Full release is a spike; rolling release is a ramp.

Inbound Receiving: Throughput Must Outrun the Curve

The receiving plan has one job: inbound throughput must outrun the daily parcel volume curve, or the bottleneck starts at the dock and everything downstream idles. In our case the curve demands 5,500 parcels a day at peak; if receiving only clears 3,000 units a day, the peak never actually ships on the planned days, and the whole timeline slips by the length of the receiving queue.

Dock door scheduling is the first lever. Twelve containers over three days means four dock slots a day at minimum, and the schedule should be built from the SKU-priority list, not from truck arrival order. The highest-velocity SKUs, the ones that clear most of the backorders fastest, get the earliest dock slots and the first scan passes. Surge labor is the second lever: agree on a standby labor pool two weeks out, with a call-in threshold, so the extra pickers and scanners are already cleared for the days the curve says they are needed, instead of being sourced at overtime rates the day of. The third lever is ASN reconciliation done at the dock, not after: compare the ASN against actual receipt line by line, flag shorts and damages immediately, and update the inventory system the same day, because the allocation plan in the next section is only as good as the received quantities it runs on. If the ASN says 6,700 units and the container holds 6,400, that 300-unit difference has to appear in the ledger before the allocation meeting, not after the third fulfillment day.

Carrier Mix: Primary, Backup, and Overflow Routing

The carrier plan is where most surge plans break, because it is built around what the brand wants to tender instead of what the carrier can physically collect. Pickup capacity is the hard constraint: a carrier's daily pickup is a finite number of stops and a finite truck volume, and when your volume spikes past it, the carrier does not fail silently, it fails loudly, with missed pickups and a growing dock. So the first number in this section is not your rate, it is your contracted daily pickup ceiling, and the gap between the parcel curve and that ceiling is what backup and overflow exist to absorb. To design the primary and backup structure systematically, start with our multi-carrier shipping strategy guide, then check carrier redundancy design and when a regional carrier saves money.

Primary and backup carriers get split by zone and weight band before the surge, not during it. Decide which zones the primary carrier carries, which zones the backup carries, and where the split point is, so that on a surge day the routing rule is a lookup, not a judgment call. In our case, the primary contract covers 2,500 parcels a day; two pre-approved backup carriers add another 1,500; and a spot-market overflow lane covers the last stretch at a premium. The overflow rule is threshold-triggered and rolls daily: if a carrier's pickup is full at cutoff, the overflow volume rolls to the next lane automatically, and the day's split is recomputed every morning from actual pickup confirmations.

The piece that makes all of this possible is pre-approval. A carrier that has never seen your volume cannot onboard in a day; accounts, labels, zones, and rate sheets all have to exist before the peak. This is where a channel-neutral view of carriers pays off: instead of being locked into whichever carrier the marketplace or platform defaults to, the brand and 3PL compare US domestic carrier options side by side on the same screen, pre-approve the backups, and execute the split through one portal, a spreadsheet, or an API call. The comparison is done once, calmly, two weeks before arrival, and the execution is just routing on the day. For the full ledger of last-mile cost and experience, see our guide on the true cost of last-mile delivery.

Inventory Allocation and Customer Communication

When 53,000 parcels of inventory land at once, the temptation is to ship in arrival order: first container in, first orders out. That is almost always wrong. Allocate against channel sell-through, not arrival order. If 70% of the backorders are for SKUs that move on one channel, those SKUs get the first dock slots, the first scan passes, and the first allocation, and the slower-moving SKUs ride the later batches. The goal is to burn the backorder list down fastest, not to clear the dock fastest.

Safety stock is the second rule. Do not ship the last unit of a fast SKU just because it is on the dock; hold the reserve the brand's replenishment policy defines, so the surge does not create the next stockout two weeks later. And do not oversell: the inventory system should reflect received-and-available quantities, not arrived quantities, so the storefront never promises units that are still sitting in a container under exam.

Customer communication runs on three principles: notify early, promise narrowly, follow up after. Delay notifications should go out as soon as the ETA slips, with a new window, not a vague "soon", and the window should be padded by a day or two because surge fulfillment runs late. When the order ships, send the tracking immediately. And after the peak clears, a short follow-up to the affected customers (a real one, not an autoresponder) buys more goodwill than any coupon, and it costs less than the compensation program in the next section.

Cost Accounting: What the Surge Really Costs

Now the case settles its accounts. The surge had four cost buckets. Surge labor: five peak days, eight extra dock and pick workers per day, ten-hour shifts at time and a half, about $28 an hour, comes to roughly $11,000. Carrier premium: about 15,000 parcels went through overflow lanes at an average spot rate of $9.20 against a contract rate of $6.50, an extra $2.70 each, about $40,500. Demurrage and overflow storage: twelve containers held at demurrage rates and pallets in paid overflow space added about $5,400. Customer compensation: roughly 6% of the 9,000 backordered customers got a partial refund or credit averaging $4, about $2,200. Total: about $59,000, or roughly $1.10 of incremental cost per parcel across the surge.

Compare that against steady state. The normal cost per parcel, all-in, runs around $8.50; during the surge window it ran about $9.60. The delta is small per parcel, but it is the whole $59,000, and it landed on top of a week the operations team will not soon forget. The point of accounting for it in buckets is not the total; it is the split, because each bucket has a different prevention lever. As a hypothetical example: pre-approving two backup carriers costs onboarding time and a small setup fee, but it is what turned a $40,500 spot premium into a $20,000 backup-lane cost at worst, because backup lanes were contracted at rates between contract and spot. A surge-labor standby agreement, a few hundred dollars to hold the option, avoids paying same-day overtime premiums on all five peak days. And a broker communication loop costs nothing but a daily call, while it shaved two days off the hold in Scenario B. The rough math: about $8,000 of prevention spending avoided about $50,000 of surge cost. The peak is predictable, and predictability is purchasable.

Capacity planning itself is a loop rather than a one-time project; the methodology for finding the weakest link before fixing it is broken down in our guide on ecommerce shipping capacity planning.

The 12-Point Capacity Checklist

Brand side, six items. (1) Maintain a container-level ETA tracker and convert every ETA into daily expected parcel volume the day it changes. (2) Hold a capacity review with the 3PL two weeks before any large arrival, using the peak-day gap as the agenda. (3) Pre-approve backup carriers and sign the overflow rate sheets before the surge, not during it. (4) Define allocation rules by channel sell-through and safety stock before the containers land. (5) Set customer communication templates for delay, ship, and follow-up, with padded promise windows. (6) Reconcile ASN against actual receipt within 24 hours of each container clearing.

3PL side, six items. (1) Publish dock door and receiving slot schedules from the SKU-priority list, not arrival order. (2) Hold a standby surge-labor pool with a call-in threshold, agreed two weeks out. (3) Confirm carrier pickup ceilings in writing and rebook appointments within hours of any ETA change. (4) Run the daily overflow rule: recompute the primary/backup split every morning from actual pickup confirmations. (5) Flag ASN shorts and damages at the dock, the same day. (6) After the surge clears, publish a carrier performance review: on-time, missort, and cost per parcel per lane, which becomes the input to the next plan.

Both sides, one shared sentence: the delay is a fact, but the peak is a plan. Convert the ETA, reconcile the capacity, split the carriers, and the week that looked like a crisis becomes a busy week.

Want your carrier mix and overflow routing ready before the peak?

EasyShippingX delivers multi-carrier real-time rate comparison, batch label printing, labels, and tracking for US domestic shipping: routing rules can hold pre-set backup carriers, multiple carriers run in parallel at peak by zone and weight band, overflow rolls to the next lane automatically when a pickup is full, executed through one portal, a spreadsheet, or the API. The pieces that most often break a surge plan, primary and backup splits and overflow routing, no longer have to be same-day judgment calls. See pricing or book a demo.

FAQ

Arrival order looks fair, but it slows down the sell-through of your fastest SKUs and clears the backorder list more slowly. Allocate against channel sell-through instead: fast SKUs get the earliest dock slots, first scan passes, and first allocation, so the backorder list burns down fastest rather than the dock clearing fastest. Hold safety stock and never oversell.
A carrier's daily pickup is a finite number of stops and a finite truck volume. When your volume spikes past it, the carrier does not fail silently: it misses pickups and the dock grows. So the first number in a surge plan is not your rate, it is your contracted daily pickup ceiling, and the gap between the curve and that ceiling is what backups and overflow absorb.
A one-shot arrival is a single-day spike; rolling release is a multi-day ramp. The ramp is easier on docks and carriers, but only if you recompute the primary and backup split and pickup bookings every day as new batches are confirmed, instead of assuming the hold ends in one release. Stage and label hold-adjacent SKUs before release so receiving is a formality when paperwork lands.
In the worked example, about $8,000 of prevention spending (pre-approved backup carriers, a standby labor agreement, a daily broker communication loop) avoided about $50,000 of surge cost: spot premiums, same-day overtime, demurrage, and customer compensation. The peak is predictable, and predictability is purchasable. Each cost bucket maps to a different prevention lever, so account for the surge in buckets, not just as one total.