Treat “switch to a regional carrier and save 15 to 25 percent overnight” as an unverified sales hypothesis, not an industry benchmark or current quote. The actual result must be calculated from your destination ZIPs, parcel profile, full surcharge schedule, and exception costs.
The reality is more conditional. A regional carrier saves money only when your shipment profile lines up with its network: your destinations inside its coverage area, your package weights in its sweet spot, your volume above its minimum, and your total cost, after every surcharge, still below what you pay today. When those conditions are not met, the same carrier can quietly cost you more than the national alternative you were trying to escape.
This article provides a four-variable break-even model, five checks, an explicitly illustrative rate table, and a test-before-you-commit playbook. The table explains the shape of the model and cannot replace a carrier's current written quote.
A regional carrier's savings logic is stop density inside its coverage area; everything outside it is resale
Second-carrier evaluation: stage 3
You are at stage 3 of a second-carrier evaluation. Connect quotes, actual invoices, exception handling, and added operational work for comparable shipment segments. Mark missing evidence as pending and assign an owner to collect it.
A regional carrier operates around specific ZIPs and lanes, so labels such as “West Coast” or “East Coast” are not sufficient eligibility tests. Networks expand, contract, and hand parcels to partners; request a dated ZIP coverage file from every candidate carrier.
The difference from a national carrier is a difference of strategy, not just scale. UPS and FedEx run giant hub-and-spoke systems that span the continent, moving packages through central sortation facilities before fanning them out to local routes. That reach costs money, and the cost shows up in every zone-based rate. A regional carrier skips most of the long-haul leg. Its trucks run short distances, stop at many houses per route, and feed on lower facility and labor overhead. That density is the entire source of its price advantage.
Use regional carriers as product-validated paths in a carrier mix. Intercept uncovered orders and revalidate an alternative. Some products may arrange partner delivery, but charges, transit, handoff, and tracking depend on their terms. Do not treat a partner model as the default for all regionals.
The Core Rule: Savings Are a Zone and Volume Game
The savings you can capture is not a flat percentage. It is the product of three factors: zone fit, weight profile, and volume. Zone fit means how much of your volume lands inside the carrier's coverage area. Weight profile means how heavy your average parcel is. Volume means whether you clear the carrier's minimums. Multiply the three together and you get the real number. If any one of them is near zero, the whole product collapses.
Zone fit matters most. Parcel delivery economics are built on stop density: how many packages a driver can drop in a single neighborhood in a single shift. A regional carrier inside its home territory has exceptional density, so its cost per stop is genuinely lower. Outside that territory it has no density at all, so it must buy capacity from someone else. You pay for that resale, plus the carrier's margin on top.
Weight is the second lever, but there is no universal sweet spot across regional carriers. Request quotes against your actual weight and dimension distribution, then identify the bands that retain an advantage after fuel, oversize, and DIM rules.
Volume is the gatekeeper, but minimum volume and per-piece minimum charges are contract variables. Request a written quote using trough-season volume and segment it by destination density; do not treat a familiar rule of thumb as the carrier's current threshold.
Illustrative scenario: if only part of the volume remains in-network and out-of-network parcels are resold through a partner, blended cost can exceed the national-only baseline. The specific percentage is not the point; confirm handling and price for every out-of-network ZIP before signing.
The Break-Even Model: Four Variables, One Number
Before you talk to a sales rep, build the model that actually decides the question: what does switching add to your bottom line each week? The answer reduces to four variables, and they map exactly onto the story so far.
Coverage rate (c).The share of your parcels that stay inside the carrier's network. This is the multiplier. If 60% of your volume is in-network, the headline discount applies to 60% of your parcels; the other 40% leak out at resold national rates.
Minimum volume (V).The weekly volume you can sustain, including your seasonal trough. This is the gatekeeper. Below the carrier's minimum you pay list price or per-piece minimums, and the model collapses no matter what the other three numbers say.
Exception rate gap (Δe).The difference between the regional carrier's exception rate and your current carrier's. Do not apply a generic cost per exception; use your own data to calculate C_e from replacement labels, reships, support time, refunds, and churn.
Cost difference (Δ).The all-in per-parcel saving, base rate plus every surcharge, compared with your current landed cost. Sticker rates are not the number; the number is what survives the full rate card.
Put them together and the arithmetic is one line:
Net weekly savings = V × c × Δ − V × Δe × C_e − F
where C_e is the cost of a single exception and F is the fixed cost of the switch (integration, contract setup, running a second vendor). The middle term is the exception tax: the hidden cost that quietly eats the discount. The break-even condition is simply net savings greater than zero, which inverts to a volume bar: V > F / (c × Δ − Δe × C_e).
Worked example.A seller ships 1,000 parcels a week with 80% in-network coverage, an all-in saving of $1.80 per parcel, an exception-rate gap of 1.5%, $25 per exception, and $400 a week in fixed switching cost: gross saving 1,000 × 0.80 × $1.80 = $1,440; exception tax 1,000 × 0.015 × $25 = $375; net result $1,440 − $375 − $400 = $665 a week, roughly $2,900 a month.
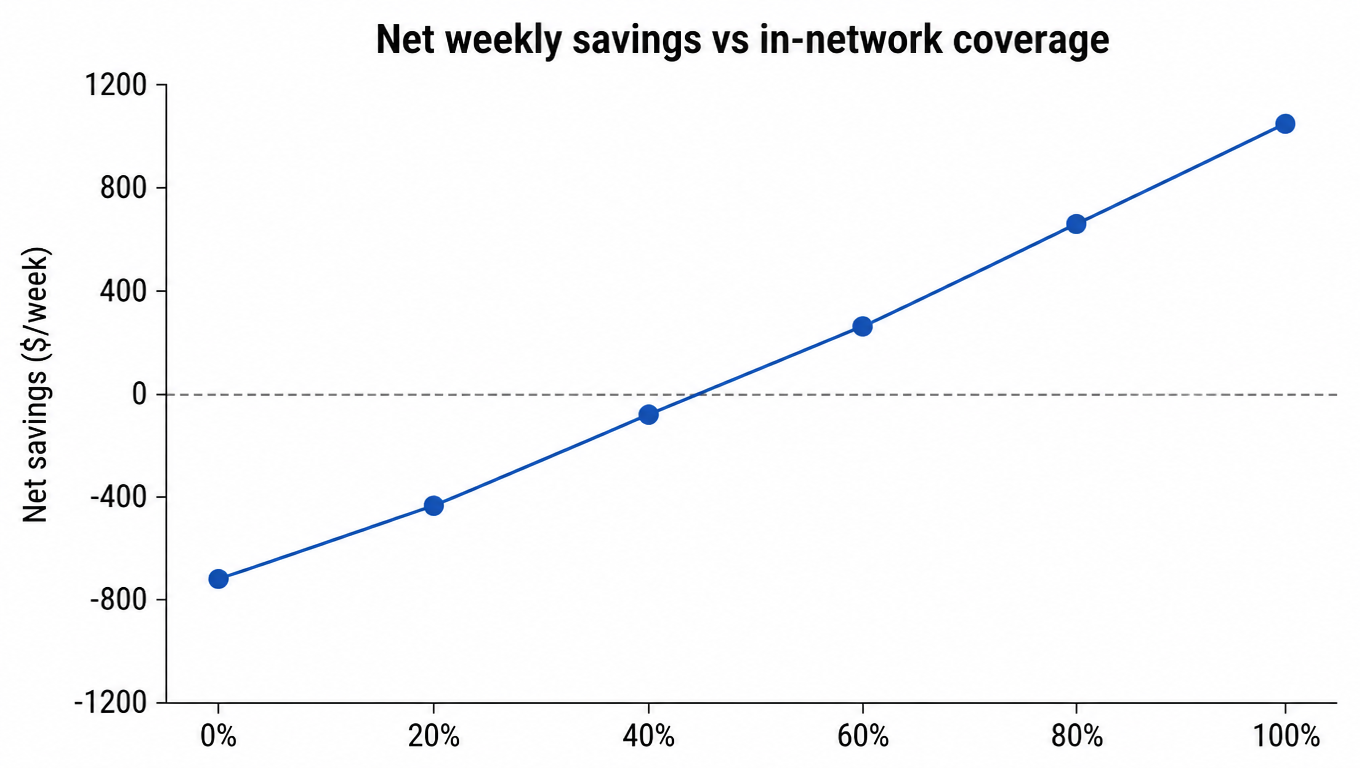
Continuing the illustrative assumptions above, 50 percent coverage produces $125 in weekly net savings, 40 percent produces a $55 weekly loss, and the break-even coverage is 43 percent. Those results belong only to this example; changing any input moves the boundary.
Net savings vs coverage: below 43% the deal loses money
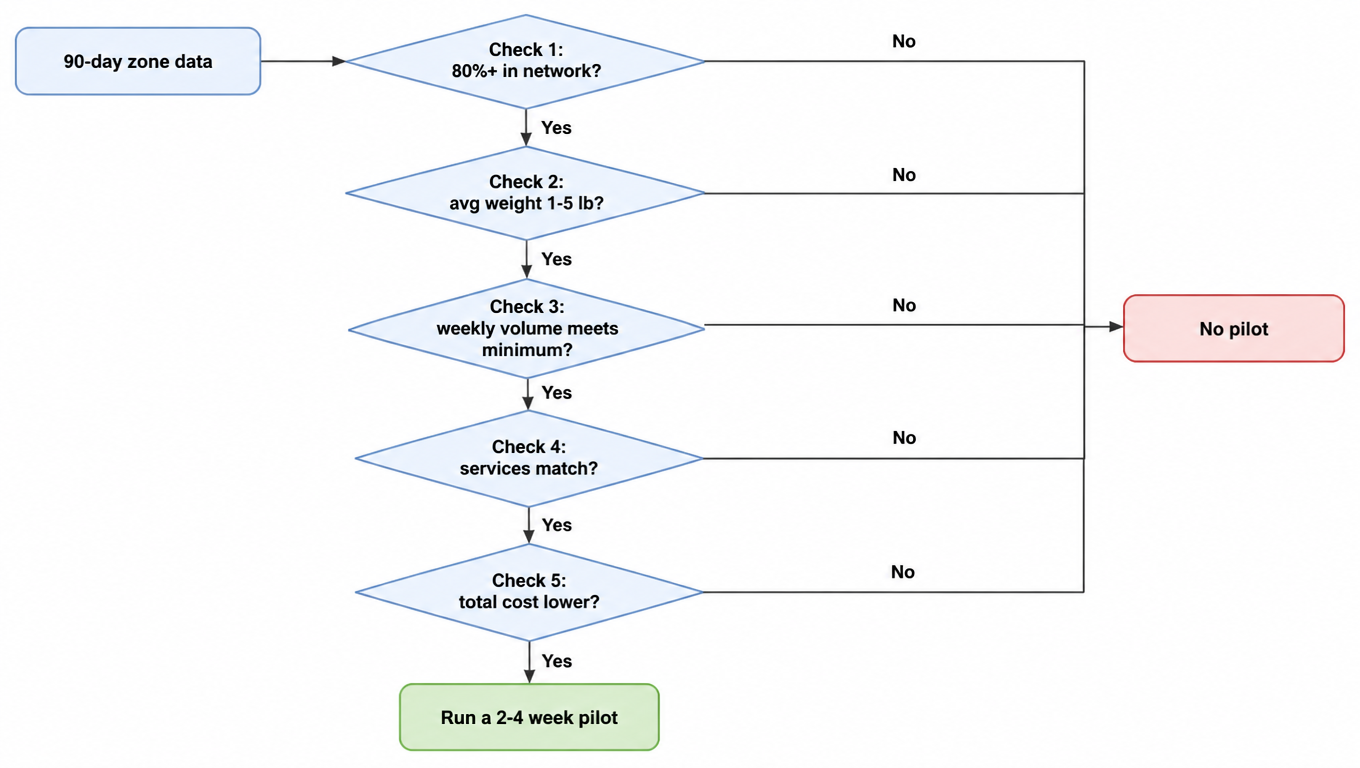
The five checks below are the practical version of this model. Check 1 measures the coverage rate, Check 3 enforces the volume gate, Check 5 computes the true cost difference, and the exception-rate gap is measured in the pilot, where you track exceptions side by side with your national carrier on the same lanes.
The Decision Framework: 5 Checks Before You Switch
Before you talk to a single sales rep, run these five checks against your own data. Each one has a rough pass bar. This is a funnel: fail the first check and the rest do not matter.
Check 1: Zone fit.Export your own shipment history and map destination ZIPs against the carrier's dated coverage file. The pass bar is not a fixed percentage; it is the break-even coverage calculated by the model above plus your required safety margin.
Check 2: Weight profile.Compute the average and median weight of the parcels that would go to the regional carrier. The pass bar: the bulk of your volume sits in the 1 to 5 lb range. If most of it is over 10 lb, the advantage narrows fast.
Check 3: Volume.Can you sustain the carrier's minimum weekly volume through the whole year, including your seasonal trough, not just your peak? The pass bar: yes, comfortably, with room for the carrier to want more.
Check 4: Service requirements.Compare transit promises, weekend delivery, COD, signature options, declared-value limits, and claims handling with customer requirements. The recommended threshold is that the candidate meets every contracted critical service promise; this is an internal operating gate, not an industry standard.
Check 5: Total cost.The base rate is a teaser. Ask for the full rate card: fuel surcharge, residential surcharge, out-of-zone fees, oversized and dim-weight pricing, address correction, returns handling. Rebuild your average parcel's cost line by line and compare against your current landed cost.
The five-check funnel: any failed check means no pilot
No single check is pass or fail in a vacuum. A thin volume number can sometimes be bought down with a higher commitment, and a weak weight profile can be offset by an exceptional zone fit. But two checks are close to disqualifying on their own: a poor zone fit, because the savings never materialize, and a service gap, because the savings get spent on lost customers.
The Numbers: Rate Cards Side by Side
The tables below are illustrative comparisons built from published rate cards and typical regional-carrier discounts, not quotes. Your negotiated pricing will differ, but the shape of the numbers is the point. They compare a regional carrier against a national ground service for a 1 lb parcel and a 5 lb parcel across zones 2 to 8.
1 lb parcel, per piece
Zone
National ground
Regional
Savings
2
$5.20
$3.90
25%
3
$5.50
$4.20
24%
4
$6.00
$4.70
22%
5
$6.70
$5.50
18%
6
$7.50
$6.60
12%
7
$8.40
$8.00
5%
8
$9.30
$9.10
2%
5 lb parcel, per piece
Zone
National ground
Regional
Savings
2
$8.10
$6.60
19%
3
$8.60
$7.10
17%
4
$9.40
$7.90
16%
5
$10.50
$9.10
13%
6
$11.80
$10.70
9%
7
$13.20
$12.90
2%
8
$14.60
$14.40
1%
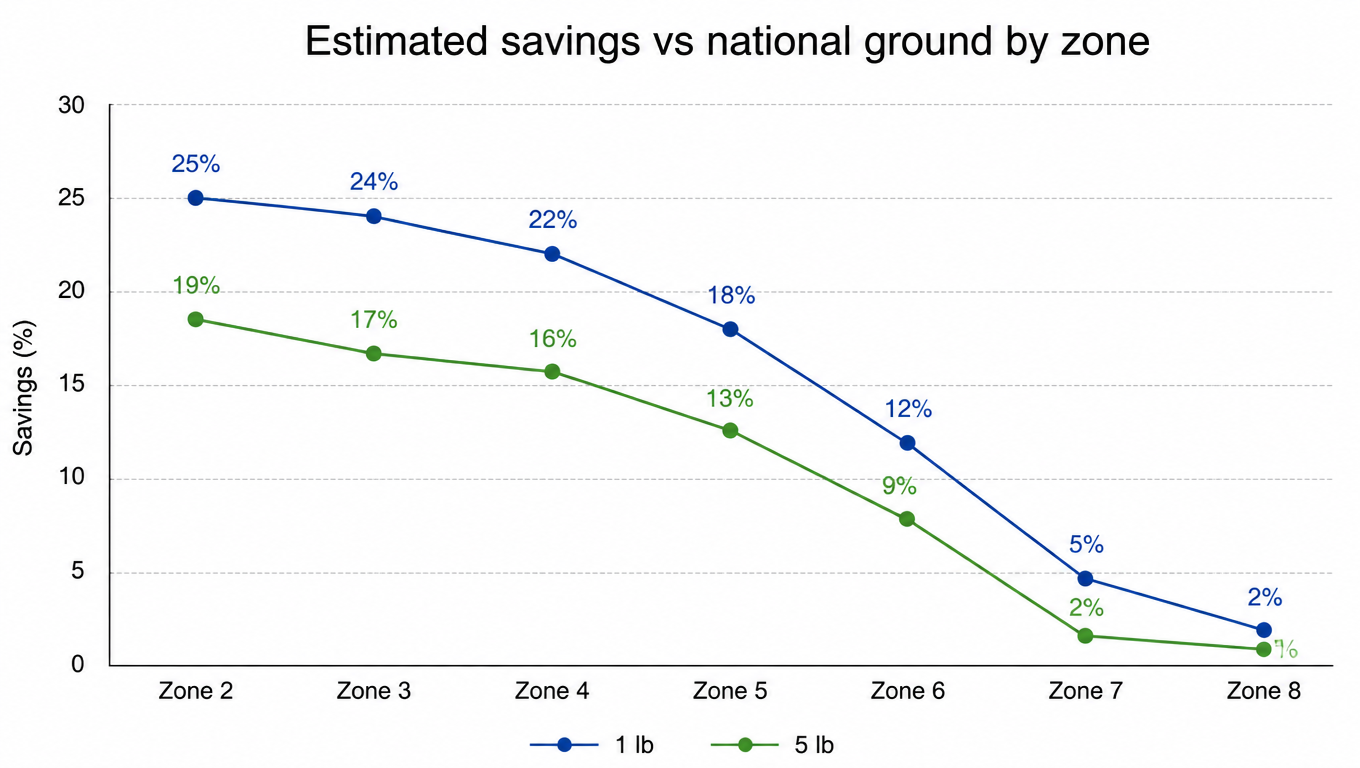
Savings peak in close zones and shrink with distance and weight
Read the tables like this. Savings are biggest in the close zones and shrink steadily as distance grows. At zone 7 and 8, the regional advantage is a rounding error, because out-of-network parcels are effectively being resold as national capacity. And at every zone, the 5 lb parcel saves noticeably less than the 1 lb parcel, because weight-based charges dilute the density advantage. The sweet spot, zone 2 to 5 at 1 to 5 lb, is where the real money lives. Everything outside that window is noise.
Methodology
Percentages, rates, and scenarios in this guide are internal illustrative inputs. The actual decision uses only your historical invoices, the candidate's dated ZIP file and written quote, and matched-lane pilot data.
When It Saves Money: Seller and 3PL Scenarios
Three profiles get the full benefit, and each one saves for a slightly different reason.
Scenario A: the urban DTC seller (illustrative).A clothing brand with highly concentrated destinations may have enough in-network density to justify a pilot. Have the candidate quote the real ZIP-and-weight file and put out-of-network pricing in the contract; do not assume a coverage rate, sweet spot, or savings percentage.
Scenario B: the regionally concentrated 3PL.A fulfillment warehouse in Dallas serves Texas and Oklahoma customers, with a few hundred parcels a day across three nearby states. LSO territory. The 3PL gets the density benefit twice: its own book of business is in-network, and its clients' customers cluster in the same region. The savings flow straight into the warehouse's margin or into its pricing pitch. The watch-out is client mix: one national e-commerce client whose buyers live everywhere can quietly drag the zone fit below the pass bar.
Scenario C: the large, light, dim-weight seller.Sellers shipping big, bulky, lightweight items, think furniture accessories, lamps, or oversized packaging, are often priced on dimensional weight, where per-pound economics matter less and stop density matters more. Regional carriers built for residential delivery can price these parcels more aggressively, and their savings on dim-weight freight often exceed what a light-parcel seller captures. The watch-out is the oversized and dim-weight surcharge line on the rate card, which must be negotiated explicitly, not discovered on the first invoice.
When It Doesn't: Hidden Costs and Traps
The same carrier that saves money for the profiles above quietly loses it for others. The traps are predictable.
Trap 1: Zone leakage.Out-of-network parcels get handed off to a partner at full national rates plus a markup. If your destination spread is wide, leakage can consume the entire discount. This is the number one reason regional deals disappoint, and it is usually buried in the contract's small print rather than in the pitch.
Trap 2: Volume minimums.Fall below the promised weekly volume and you face per-piece minimum charges or lose your negotiated tier. The danger is seasonality: a seller who qualifies in November may not in February, and the annual bill can be higher than the peak-month savings.
Trap 3: Service gaps.Do not assume regional carriers are uniformly stronger or weaker. Verify COD, weekend delivery, declared value, claims timing, and remedies carrier by carrier, then measure them on matched pilot lanes. A price advantage that does not cover the cost of service regression is not a real saving.
Trap 4: Hidden fees.Fuel surcharges, residential surcharges, address corrections, returns processing. Some regional rate cards price residential delivery as the baseline, others charge it as an add-on. Read the full card, rebuild your landed cost, and put every line in the comparison. The base-rate comparison alone is how sellers talk themselves into bad deals.
Trap 5: The scattered 3PL book.A 3PL whose customers live across ten states will only ever get a fraction of volume in-network. It manages two vendors, two sets of labels, two claims processes, and still pays national rates on most parcels. The complexity is real and the net savings are often negative. For this profile, the regional carrier is a distraction, not an opportunity.
Before switching, ask the incumbent for a written review on the same lane file. Compare the current and candidate offers against identical ZIPs, weights, surcharges, and service commitments so a headline discount is not compared with an actual invoice.
For 3PLs, reconcile quotes, final invoices, and client billing separately
Cost comparison assumes each facility’s handoff arrangement has been checked. Resolve unclear pickup or drop-off conditions before estimating tender costs.
The break-even model above screens an opportunity. A 3PL must also show how the quote for a particular client, facility, and parcel segment turns into an explainable invoice. Compare similar periods, destination ZIPs, weight/dimensions, and delivery promises. If the two paths serve different order mixes, segment the records before comparing; a mix change is not a carrier discount.
Cost layer
Evidence at quote stage
Confirmation at invoice stage
Base charge and billable weight
Effective-dated quote, service, weight/dimensions, and pricing conditions.
Join settled base charges and weight/dimension adjustments by label or parcel identifier.
Surcharges and adjustments
Complete surcharge schedule, applicability, and exceptions.
Explain applied surcharges, adjustments, reversals, and unresolved disputes separately.
Pickup, drop-off, and injection
Written facility-level handoff arrangement and fixed/per-parcel fees.
Associate tender batches with invoices and allocate fixed charges using a stated method.
Failed delivery, returns, and re-sends
Charge ownership and handling rules; unknown costs remain pending.
Link the original parcel to return/re-send records without omissions or double counting.
Added operations and client billing
Expected segregation, system maintenance, reconciliation, and support work; the client’s agreed billing basis.
Record actual workload and allocation; show the 3PL’s cost separately from charges billed to the client.
Use different denominators for different decisions
Cost per shipped parcel equals all attributable segment costs divided by parcels shipped. Cost per successful delivery uses the same attributable costs divided by successfully delivered parcels. Both include the costs of failed parcels, but their denominators differ. State the observation window, completed parcel outcomes, and outstanding invoices. If there are no successful deliveries, the second metric is undefined, not zero cost.
Quotes produce an estimate. After the pilot, confirm final cost only when charges are complete, observation windows are comparable, and open items are explained. Keep estimates and unresolved items visible when evidence is incomplete; unposted charges are not zero. Use the low-risk pilot guide to verify execution, then the carrier performance scorecard to monitor whether the result persists.
Continue investigating cost and improvement
If quotes and invoices disagree or period cost rises, start with the cost triage table and continue through reconciliation. Verify a regional carrier’s benefit using comparable segments after clarifying charges.
How to Test Before You Commit
Switching on a handshake and a rate card is how regret happens. Run a proper test instead.
Step 1: 90-day zone analysis.Pull 90 days of shipments from your carrier invoices or platform reports, ShipStation, Shopify, your WMS, whichever you trust. Build a destination distribution by zone and state, then overlay the candidate carrier's coverage map. This single spreadsheet answers Check 1 and tells you whether the conversation is even worth having.
Step 2: 2 to 4 week pilot.Pick one or two dense zones and move a small slice of volume, 10% to 20%, onto the regional carrier. Track on-time delivery, exception rate, and claims side by side with your national carrier on the same lanes. Do not announce a full switch; you are gathering data, not making a commitment.
Step 3: Measure landed cost, not sticker price.Compare the real cost per parcel: base rate plus fuel, surcharges, address corrections, returns handling, and the admin time of a second vendor. A savings figure that ignores returns and exceptions is fiction. Landed cost is the only number that should drive the decision.
Step 4: Negotiate the contract.Get rate locks, surcharge waivers or caps, on-time and claims KPIs with remedies, and a clean exit clause. Regional carriers are hungry for volume and will negotiate; the ones who will not are telling you something.
And keep the national carrier in the mix. The winning setup for most operators is a parallel multi-carrier strategy, dense zones on the regional, the rest on national, reviewed quarterly. Cold-turkey switching is a bet; parallel running is a hedge.
The Bottom Line
Here is the one-line rule: a regional carrier saves you money when your parcels land inside its network, at the right weight, at the right volume, at the right total cost. Change any one of those and the savings shrink or disappear.
Run the break-even model before you call a single sales rep and you will know the exact line: below your break-even coverage, the deal loses money regardless of the pitch.
The decision is quick to make once you have the data. All five checks pass, run a pilot and measure landed cost. Any check fails, do not rush, fix the profile first or stay put. The carriers are not going anywhere, and neither is the 15%, it will still be on the table the day your data actually supports it.
Your action list: this week, export your zone data and run the five checks. Next month, if the checks pass, run the pilot. Then review the landed-cost comparison quarterly. That is the whole playbook, and it keeps the 15% story where it belongs: in the spreadsheet, not in the sales pitch.
FAQ
It is a sales hypothesis to test, not a universal result. Put the candidate's current ZIP coverage, complete written rate card, service commitments, and pilot exception data into the break-even model; the claim is true for your operation only when net savings remains positive with a safety margin.
Screen suitable lanes by product, origin warehouse, and destination, then pilot a small batch. Uncovered orders move to the configured alternative, while partner final mile uses its matching charges, transit, and tracking rules.
You can evaluate one, but should not assume it will be worthwhile. Calculate in-network coverage from your own destination history, then model out-of-network handoff prices and added operating cost; the pass bar should come from your break-even result, not a fixed percentage.
There is no universal timeline. Estimate data preparation, contracting, API or file integration, testing, and the pilot separately in the project plan; scale only after a matched-lane pilot validates landed cost.
Do not generalize by carrier category. Verify current ZIP coverage, transit commitments, weekend delivery, declared value, and claims terms for each candidate, then compare it with the incumbent on matched pilot lanes.
Net weekly savings = V × c × Δ − V × Δe × C_e − F, where V is weekly volume, c is in-network coverage, Δ is the all-in per-parcel cost difference, Δe is the exception-rate gap, C_e is the cost of one exception, and F is weekly fixed switching cost. Switch only when net savings is positive; invert the formula to find your break-even coverage, below which the deal loses money no matter the discount.
Can I confirm regional-carrier savings before all pilot invoices are available?
Report only an estimate with open items. A final conclusion requires complete costs, comparable segments, and consistent observation windows; unposted charges are not zero.
Continue after this stage
Continue after reviewing this stage’s evidence and open items. If the conclusion is unresolved, retain the original path or assign manual verification.