A 3PL cannot evaluate base rates alone. Residential, fuel, peak, dimension, address-correction, return, and out-of-network handoff terms determine all-in cost, and those terms vary by carrier, account, and effective date.
Regional carriers belong on the candidate list, but no fixed discount, transit improvement, or all-in pricing should be assumed. Test OnTrac, GLS, Better Trucks, Veho, LSO, Spee-Dee, UniUni, GOFO, SpeedX, and SwiftX against the same real parcel file, current ZIP response, and written quote.
Model SpeedX’s permanent oversize adjustment separately: listed bands start at 24 in longest side or 120 cm L+W+H; weight over 30 lb carries $200 per package plus partner shipping rates. Use the higher surcharge when two types apply. Length over 48 in or weight over 50 lb still requires prior written approval.
This guide is written for both sides of the table: operators who want the mechanics, and decision-makers who need the business case. It covers where the savings actually come from, profiles the regional carriers that matter, gives you a framework to compute ROI from your own billing data, walks through a hybrid network design and a six-step migration playbook, and ends with an action checklist you can hand to your team on Monday morning.
Regional carriers trade density for cost inside their footprints, the underused second card next to national ground
1. Why 3PLs Are Rethinking the Last Mile
Start with your own invoices: separate base rate and every surcharge by lane, weight, dimensions, residential attribute, and exception status. Prior-year increases or public surcharge examples cannot replace the current account invoice.
Model margin impact from your own unit economics. Transport share, client pass-through rules, and exception cost determine why the same carrier quote can have different value for different 3PLs.
Regional networks change through acquisitions, partnerships, and new nodes, so any historical footprint can only trigger a fresh quote. Current lane eligibility, responsibility boundaries, and fallback capability are the selection evidence.
2. Where the Savings Actually Come From
The first hypothesis is rate structure: shorter lanes may reduce linehaul and sort cost. Whether a carrier passes that difference into your quote can only be verified with a complete written rate comparison on matched lanes and parcel profiles.
The second hypothesis is density: compact lanes may reduce cost per stop. This is a mechanism to test, not a guaranteed saving; map your destination ZIPs and check whether the written quote actually reflects a density advantage.
The third hypothesis is surcharge structure. Do not assume a national carrier always adds a specific fee or a regional carrier always quotes all-in; compare current residential, fuel, peak, weekend, dimension, address, and return terms line by line.
The fourth hypothesis is service outcome. Transit, on-time rate, returns, support load, and repeat-purchase impact must come from matched-lane pilots and your own data, not from carrier category.
Calculate surcharge sensitivity directly from invoices: monthly residential volume multiplied by the current account fee, plus fuel and peak terms. Replace every sample amount with account data.
3. The Regional Carrier Landscape
GOFO, SwiftX, UniUni, and SpeedX services offered through EasyShippingX:Delivery to APO/FPO/DPO military or diplomatic addresses and PO Box addresses is not supported, even when the destination ZIP is within the coverage area.
OnTrac, GLS, Better Trucks, Veho, LSO, and Spee-Dee can change footprints, partner relationships, and service codes. For every candidate, request a dated ZIP file and identify which lanes use the owned network versus a partner handoff.
Apply the same gates to e-commerce networks such as UniUni, GOFO, SpeedX, and SwiftX: current coverage file, written transit, complete charges, API event dictionary, claims terms, capacity commitment, and financial diligence. Expansion pace or marketing metrics should not enter routing rules directly.
A landscape section generates a shortlist; it does not declare a winner. Compare every candidate with the current baseline on matched lanes, parcel profiles, and observation windows.
4. When It Pays Off: An ROI Framework
Regional carriers are not universally cheaper; they are cheaper where they are dense. The ROI question is whether your volume profile matches their footprint profile, and the answer is computable from your own billing data.
A favorable profile is not a fixed coverage rate or daily parcel count. Eligible volume must amortize integration and operating cost, trough-season volume must meet contract minimums, and the complete quote must beat current all-in cost on matched lanes. Calculate the pass bar from your break-even model.
Evaluate an unfavorable profile parcel by parcel: fragmented coverage, expensive handoffs, dimension or service mismatch, and higher exception cost can each turn the model negative. Do not assume a carrier category automatically fits or rejects a parcel type.
The method has four steps: build a matched-lane all-in baseline from historical invoices; filter eligible volume with a dated ZIP file; insert the candidate's actual written quote instead of a universal discount; then add pilot-observed transit, exceptions, returns, and operating cost to ROI.
A worked example makes the scale concrete. A 3PL moving 120,000 parcels a month at an average all-in cost of $8.50 spends about $1.02 million monthly on last mile. If 30 percent of that volume lands inside one regional footprint, and the regional rate saves 20 percent on those parcels, the savings are roughly $61,000 a month, about $734,000 a year.
Metric
Illustrative value
Monthly parcel volume
120,000
Average all-in cost per parcel
$8.50
Monthly transport spend
$1,020,000
Volume inside regional footprint (30%)
36,000
Assumed savings on eligible volume
20%
Monthly savings
$61,200
Annual savings
$734,400
One-time integration cost
$30,000 to $80,000
Payback period
under 2 months
The table is an internal illustrative model used to explain the formula, not an industry benchmark for a mid-size 3PL. Replace the integration assumption with engineering time, vendor fees, testing, training, and dual-run cost, then recalculate payback from the actual written quote.
5. Hybrid Network Design: National Linehaul + Regional Final Mile
The winning architecture is not "switch everything to regional." It is a hybrid that plays each carrier type to its strength. The default design splits the flow by zone: cross-region parcels travel through the national ground network, which is unbeatable for long-haul linehaul at scale, while in-region parcels hand off to the regional carrier for the final mile, where the national network is most expensive per stop.
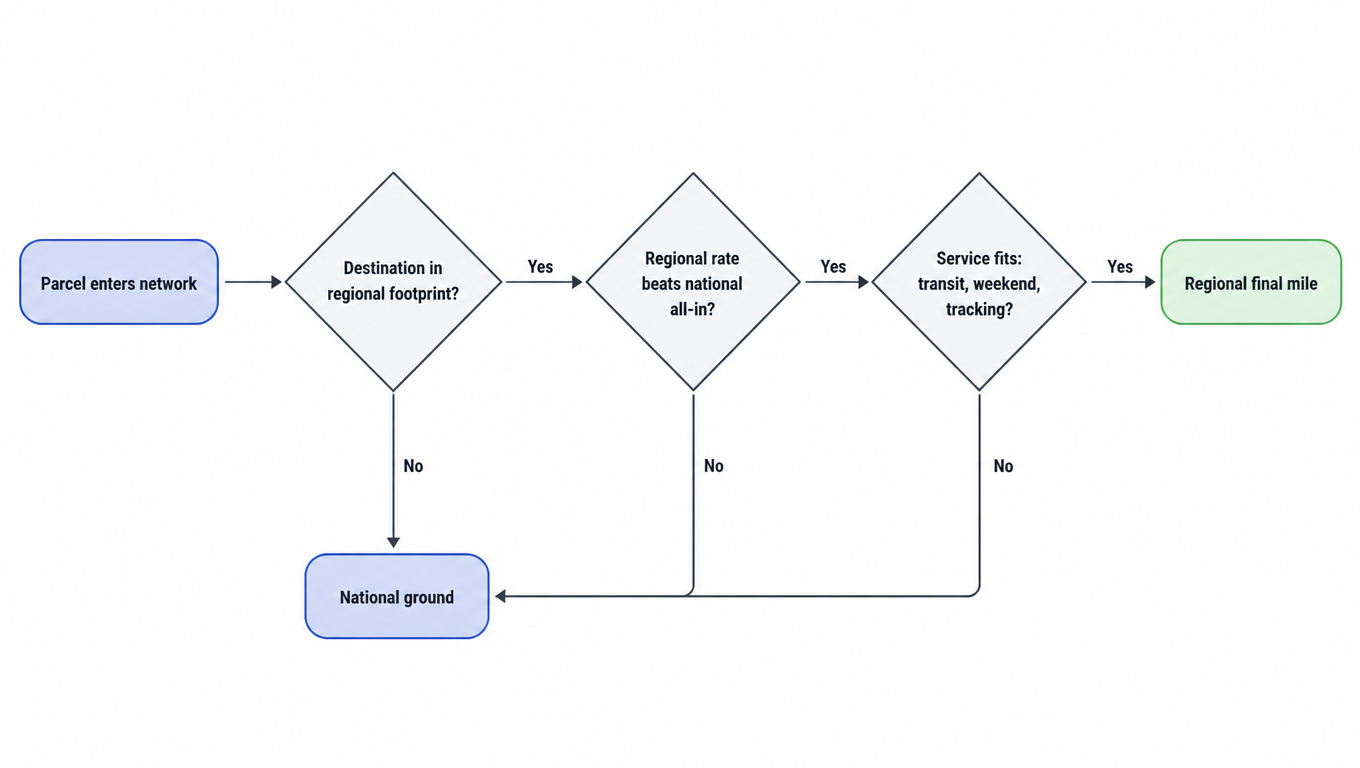
In practice this means two routing decisions per parcel. The first is geographic: does the destination fall inside a regional footprint with acceptable transit? The second is economic: on this lane, at this volume, does the regional rate actually beat national all-in? A parcel from a Dallas 3PL to a Dallas consumer is a near-automatic regional move; the same parcel to Portland, Oregon rides national ground to a regional hub and hands off there.
If your shipping platform supports lane-level eligibility, price, service, and fallback rules, it can execute the hybrid at the routing layer. Validate labels, barcodes, tracking events, exceptions, and reconciliation carrier by carrier; do not assume integration effort is inherently bounded.
Split-shipment strategy deserves explicit design. A single order with multiple boxes can be split across carriers intelligently: the in-region box goes regional, the cross-country box goes national, and the customer gets one consolidated tracking experience even though two carriers moved the shipment. This is where a 3PL earns its keep, and it is exactly what most single-carrier shippers cannot do.
Per-parcel routing: footprint, rate, and service fit all gate the regional move
The same logic extends to service features. Regional carriers increasingly offer weekend delivery, which is a genuine differentiator for e-commerce: a parcel that would sit in a national network over the weekend moves on a Saturday in a regional footprint. If weekend delivery matters to your shipper clients, build it into the routing rules rather than treating it as an afterthought.
6. The Migration Playbook: From Evaluation to Go-Live
Step one is the data audit. Choose a historical window that captures seasonality, build the ZIP-to-footprint map, and calculate current all-in cost per parcel by lane. Do not apply public surcharge examples; extract residential, fuel, peak, dimension, and exception charges from your own invoices.
The migration starts with an audit: know what each parcel actually costs before you switch carriers
Step two is contract negotiation. Ask each regional carrier for an all-in rate quote on your actual lane mix, and get the surcharge schedule in writing: residential, fuel, peak, weekend, large package. The pitfall is accepting a headline rate that looks great and then discovering a surcharge stack that recreates the national problem. Acceptance criterion: a written all-in rate card for your lanes, valid for at least twelve months, with no surprise line items.
Step three is integration. Connect the carrier's API, map labels and barcodes to your existing stack, wire tracking feeds into your client-facing tracking pages, and configure the routing engine's lane rules. The pitfall is treating regional labels as drop-in replacements; each carrier has its own label and barcode standards, and getting this wrong produces unscannable parcels and failed first attempts. Acceptance criterion: a test parcel scans correctly end to end, from your WMS to the carrier's final scan, on every carrier you onboard.
Step four is the pilot. For planning, start with a limited matched-lane sample and an observation window long enough to capture normal variation; sample size and duration should come from baseline variance and risk budget. Compare on-time rate, exceptions, scan completeness, and claims with the incumbent on the same lanes.
Step five is the phased rollout. Expand region by region, starting with the lanes from step one's top-ten list. The pitfall is switching a whole region at once and discovering a coverage gap at the edges; expand in waves so each wave's learnings inform the next. Acceptance criterion: no shipper client experiences a service regression during the transition.
Step six is monitoring. Stand up a weekly scorecard per carrier: cost per parcel, transit time, on-time percentage, exception rate, claims per 1,000 parcels, and weekend-delivery performance. The pitfall is assuming the initial rates hold forever; revisit the scorecard at contract renewal and re-run the ROI model annually. Acceptance criterion: the scorecard exists, is reviewed weekly, and feeds directly into next year's carrier decisions.
7. Pitfalls and How to Avoid Them
Coverage gaps are the most common failure mode. Regional footprints have edges, and a parcel just outside the footprint can silently fall back to an expensive national move if your routing rules do not handle it explicitly. The fix is a three-tier fallback: primary regional, secondary regional where one exists, then national ground, with the routing engine enforcing the order. Never let a regional carrier be the only option on a lane.
Tracking visibility is the second trap, but maturity cannot be inferred from carrier category. Use test shipments to verify every required milestone, event latency, and weekend or holiday scan, then contract for missing-event remedies.
Returns are the third trap. The outbound network and the returns network are different problems, and many regional carriers have smaller returns footprints than their delivery footprints. A customer who can only drop off a return at a handful of locations will not have a good experience. The fix is to design the reverse logistics separately: regional outbound where it is strong, national returns where the drop-off density requires it, and clear routing rules for each.
Finally, treat carrier stability as an ongoing risk. Acquisitions, financing, or partner changes can affect coverage, pricing, and service; manage that risk with financial diligence, change-notice terms, enforceable exit rights, and tested fallback routing rather than a fixed carrier count.
8. Action Checklist for Decision-Makers
Pull twelve months of billing data and compute all-in cost per parcel by lane, base rate plus every surcharge.
Map destination ZIPs against the footprints of OnTrac, GLS, Better Trucks, Veho, LSO, Spee-Dee, UniUni, GOFO, SpeedX and SwiftX.
Run ROI with the candidate's actual written quote applied only to volume eligible in the dated ZIP file.
Calculate your own break-even pass bar from trough-season volume, complete surcharges, exception cost, and integration cost.
Get written all-in rate cards with the full surcharge schedule from at least two regional carriers.
Design the hybrid: cross-region via national linehaul, in-region via regional final mile, with three-tier fallback rules.
Wire tracking APIs so client-facing tracking stays milestone-level regardless of carrier.
Design a matched-lane pilot from baseline variance and risk budget before any region-wide switch.
Roll out region by region, then stand up a weekly carrier scorecard.
Re-run the ROI model annually and renegotiate at contract renewal.
Regional parcel is not a value judgment against national ground; it is a lane-by-lane procurement choice. Route a parcel only when current coverage, complete price, service requirements, API events, and pilot results all pass.
There is no fixed answer by carrier category. Have each candidate provide a complete written quote against the same real parcel file, then add coverage, out-of-network handoffs, exceptions, claims, and added operating cost to matched-lane ROI.
Build matched-lane all-in cost from historical invoices, match destination ZIPs to a dated coverage file, then calculate break-even from trough volume, contract minimums, integration cost, and pilot exception rate. There is no universal coverage or daily-volume threshold.
Do not infer this from category. Verify written transit, required tracking events, event latency, weekend scans, and claims flow for each candidate, then compare matched-lane pilot results with the incumbent.
Route by parcel-level eligibility, all-in price, service commitment, and fallback availability. Start with a limited pilot comparable to baseline; let historical variance and risk budget determine sample size and duration, then scale in stages after it passes.
Ready to route every parcel at the cheapest qualified rate?
EasyShippingX helps you run the hybrid: national and regional carriers in one integration, per-lane routing rules, real-time rate shopping with all-in cost comparison, and accessorials managed in one place. Your own-account rates pass through, and regional carriers like OnTrac, GLS, Better Trucks, Veho, UniUni, GOFO, SpeedX, and SwiftX are ready to configure.