1. Last-Mile Cost Is the Profit Lifeline of a 3PL
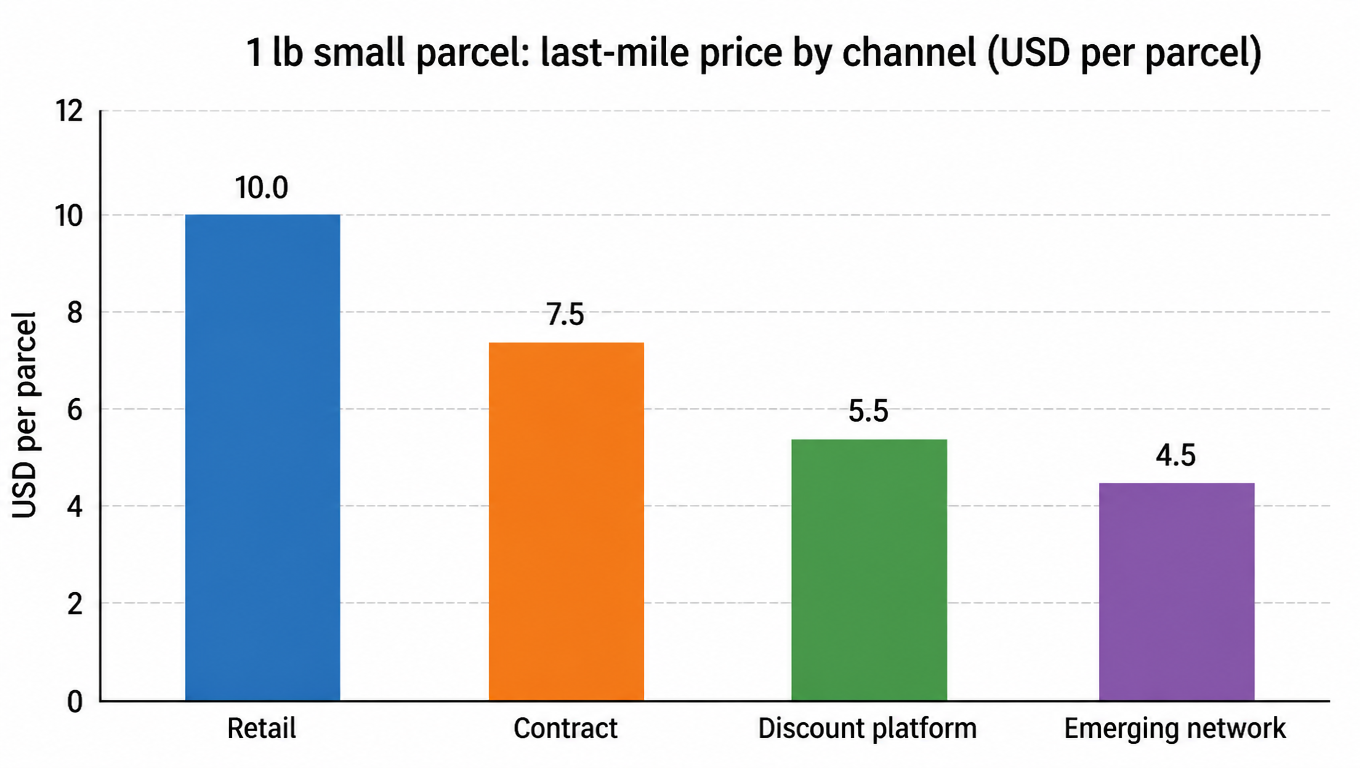
The amounts and percentage examples here are cost-sensitivity models, not customer cases, current supplier quotes, or promised savings. Calculate net improvement after transport to tender, systems, labor, claims, and returns. A 3PL/4PL reconciles by client and warehouse; a brand reconciles by SKU and region. Existing illustrations and analytical dimensions remain useful for explaining the model.
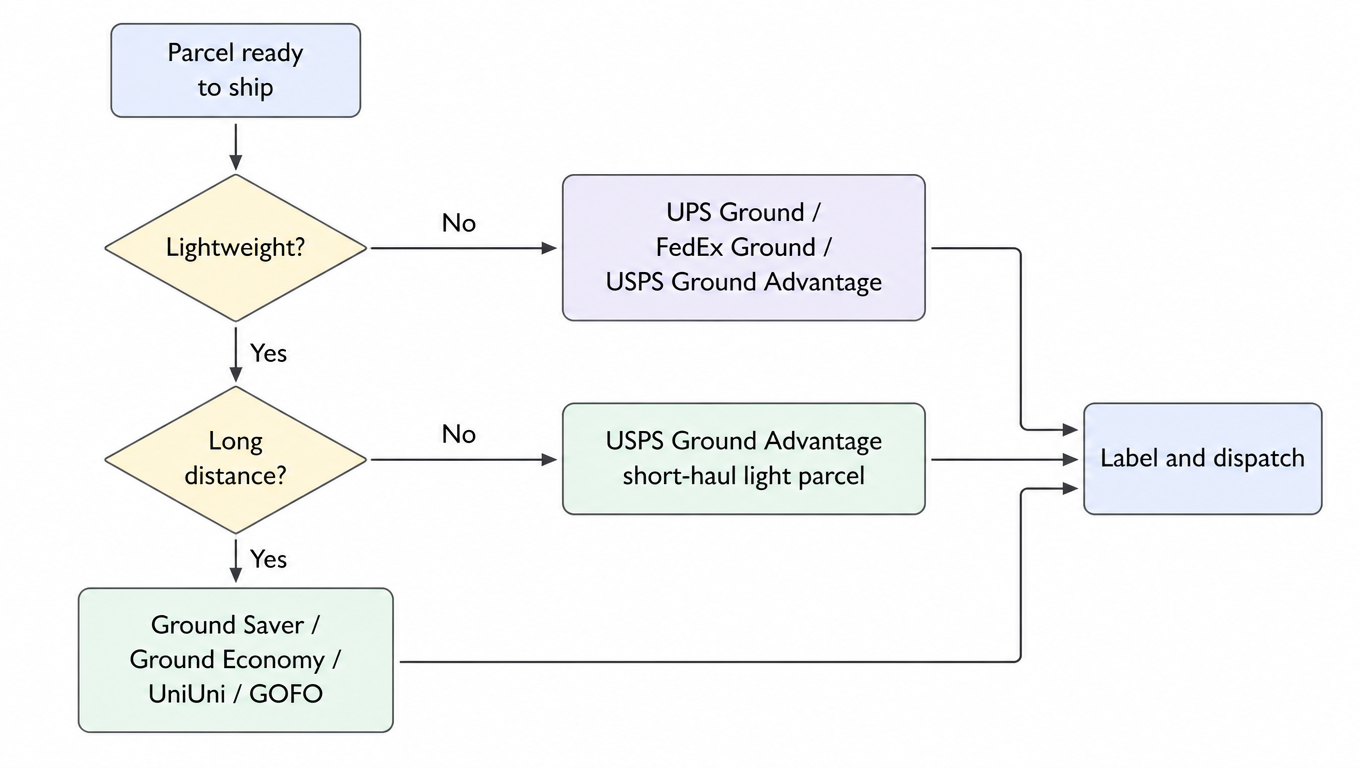
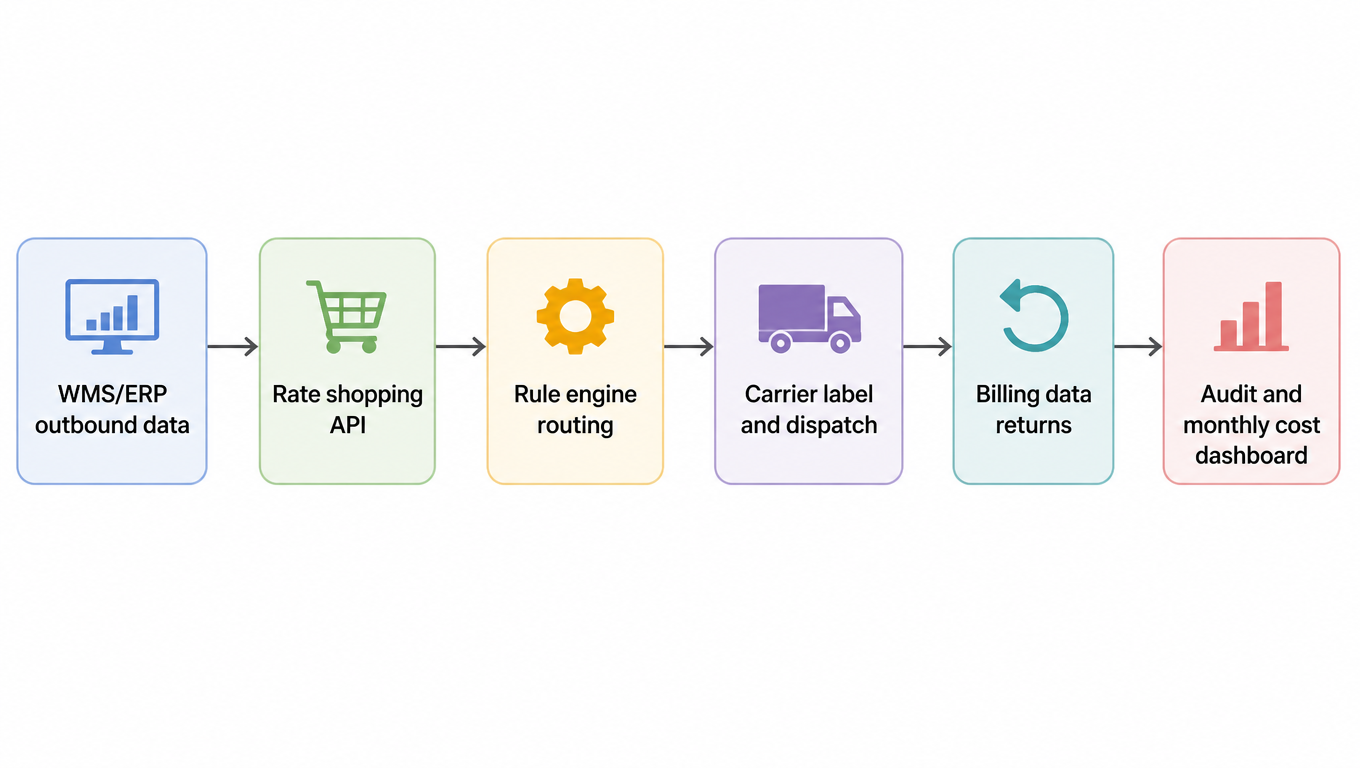
Use the shipping-cost optimization overview to prioritize the parcel-cost actions across clients. The shipping reconciliation workflow links each proposed change to the records needed to verify it on the final bill.
Use real orders and final invoices to request a rate review. Teams with existing systems can start with the API product and onboarding evaluation to confirm available quote, label, tracking, and finance information.
Both first-mile and last-mile charges can vary with contracts, fuel, capacity, measurement, and accessorials; an initial first-mile quote is not a permanently fixed final charge. This guide focuses on U.S.-warehouse-to-U.S.-recipient variables, retaining transport to tender, destination-area, and oversize items in full cost. Observe monthly changes against your own final invoices.
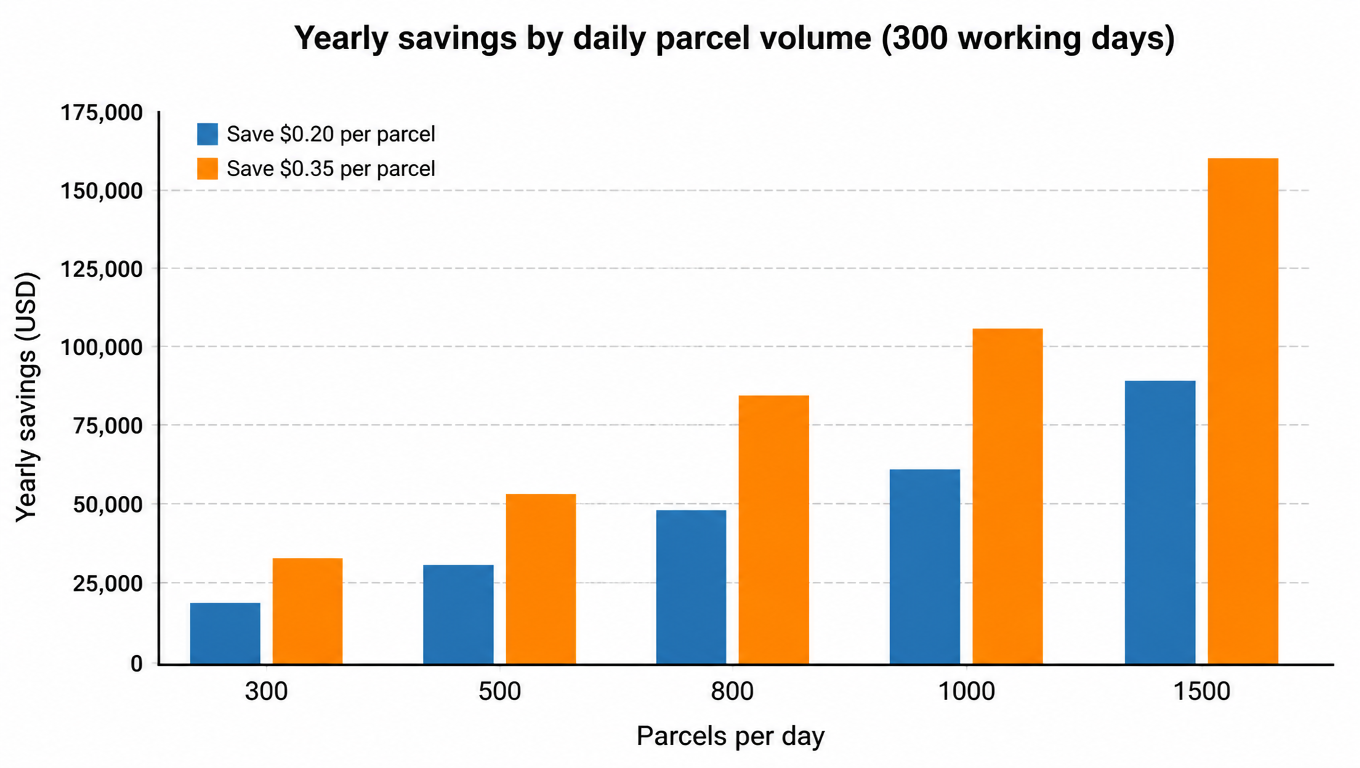
Retain a hypothetical sensitivity example: 1,000 parcels per day over 300 working days is 300,000 parcels. If net cost improves by $0.20 per parcel, the modeled annual difference is $60,000. A $1–$3 parcel margin is also an assumed input, not evidence of a 3PL’s profit or a real customer result. Recalculate with your own margins and additional costs.
More importantly, last-mile cost is written directly into your pricing. If you are $0.30 per parcel cheaper than a competitor, you can turn the same margin into a more competitive quote, or keep the savings for yourself. Cost optimization is not a finance-department reporting exercise; it is a pricing weapon for your sales team.