Cost per Successful Delivery · Metric Breakdown

Cost per Successful Delivery: The Ecommerce Metric That Exposes Cheap Fulfillment

This guide uses an assumed order to separate a $4.50 label, $18 operating cost, and $53 failure burden. CPSD combines cost definitions with delivery outcomes. The two ledgers, carrier comparison, five failure signals, break-even model, and illustrative 30-day pilot remain, with a reproducible cost ledger added. Carrier comparison figures are modeling inputs, not universal benchmarks, current quotes, or customer results.

The first part separates label price from complete cost with two ledgers and per-order fields. The middle retains the two-option example and break-even analysis, now with a reproducible ledger. The end provides an illustrative 30-day pilot plus formulas, fields, charts, and exception checks to copy into your own worksheet. Replace assumptions with orders, invoices, and client outcomes before choosing a path.

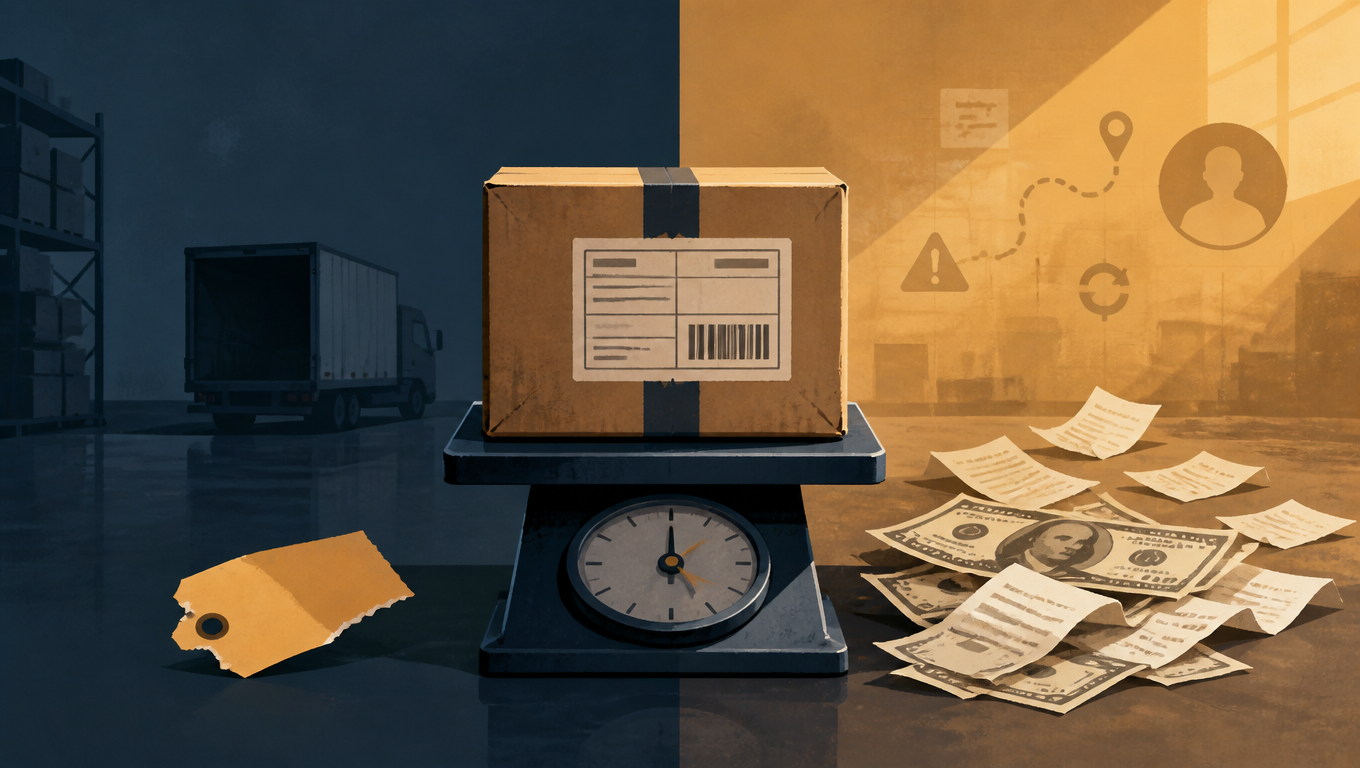
A labeled box on a parcel scale beside a $4.50 price tag, banknotes and receipts.
The number on the label is the beginning, not the truth (Illustration or assumed example, not a universal carrier rule)

1. The $4 Label That Cost $18

Here is a hypothetical order, and it is deliberately ordinary. A customer buys a $40 product from your store. The product costs $8 to make or buy. You pick the cheapest label on offer, $4.50, because the customer is not paying for shipping and every dollar of margin counts.

The package gets its first scan 36 hours after drop-off. The tracking feed then goes quiet for 72 hours. The carrier's first delivery attempt fails while the customer is at work, and no reattempt is scheduled. The customer opens a dispute. You refund the order to avoid a chargeback, then reship through the same cheap lane because the budget says so. The replacement eventually arrives, 11 days after the original order.

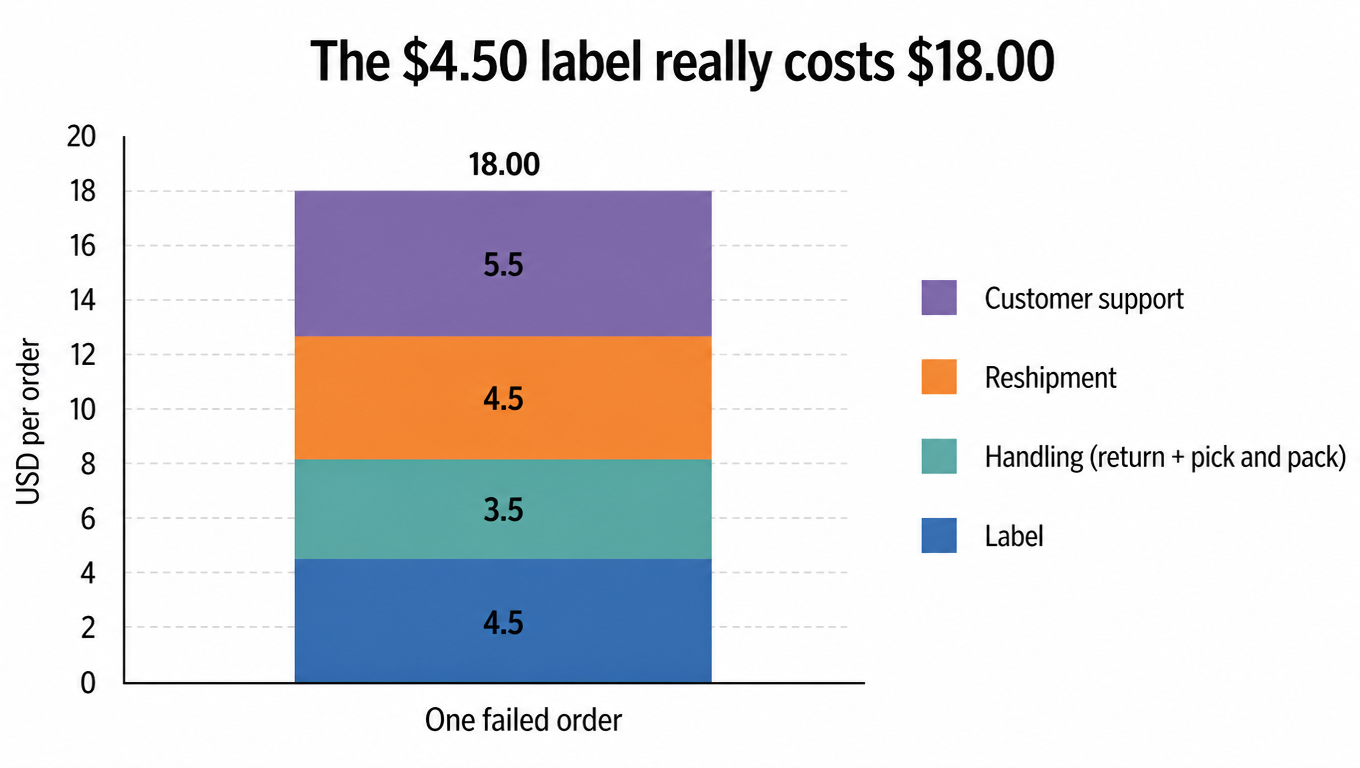
Here is what that one order actually cost in fulfillment operating expense: $4.50 for the original label, $1.50 in return-to-sender handling, $4.50 for the reshipment label, $2.00 in pick-and-pack and packaging for the replacement, and $5.50 in customer support across three tickets, for a total of $18.00. And the failure burden, kept in a separate ledger so nothing is counted twice: the $40.00 refund, the $8.00 replacement unit that went out on a refunded order, and the $5.00 discount you issued to keep the customer. Another $53.00, gone.

Stacked bar chart: cost breakdown of one failed order, label 4.5, handling 3.5, reshipment 4.5, support 5.5, total 18
The label said $4.50; the order cost $18.00 (Illustration or assumed example, not a universal carrier rule)

This is an assumed order illustrating the two ledgers. Historical figures such as 8–20% first-attempt failure or 0.5–0.8% loss/damage do not directly establish risk for a particular carrier, facility, or current client. Even a study reporting 8% or $17.20 per order needs its sample, period, failure definition, and cost scope checked. Use comparable shipment records instead of combining studies into a carrier benchmark.

2. Why Cost per Label Is the Wrong Metric

Every label price answers exactly one question: how much does it cost to hand this box to a carrier? It says nothing about whether the box arrives, when it arrives, or what happens when it does not. And failures are not free. They move cost into accounts that are much harder to see: customer-support hours, refunds, chargeback fees, replacement units, and the goodwill you spend keeping a customer who had to chase their own package.

Low label prices can transfer work into support, re-sends, and compensation. Compare carriers using actual failure reasons, outcomes, and costs within the same segment rather than treating historical values such as 0.5% and 0.8% as a current ranking of UPS, FedEx, or USPS. Those values can be explicitly labeled sensitivity assumptions, not substitutes for facility-level measurement.

The metric that captures the whole bill is cost per successful delivery (CPSD): the true, all-in cost of getting one order successfully into a customer's hands. The rest of this article defines it precisely, shows you how to calculate it from data you almost certainly already have, and gives you a 30-day pilot to start lowering it.

3. How to Calculate Cost per Successful Delivery

To keep the math honest, separate two ledgers. Operational CPSD measures how efficiently your fulfillment operation turns money into delivered orders. Failure Burden measures the financial damage of orders that did not go right. If you blend them, you double-count refunds and product costs, and the number stops meaning anything.

Operational CPSD = total fulfillment-related operating cost ÷ successfully delivered orders. Include incurred, non-duplicated pick/pack, packaging, outbound shipping, re-sends, return shipping, and exception/support labor. An unrecovered claim is not itself an extra expense: place the underlying product loss in the appropriate ledger and apply received recovery once. Expected recovery remains pending and must not be deducted twice across the ledgers.

Failure Burden = refund losses + chargeback fees + unrecovered product cost + discounts or credits issued after delivery failures. Refunds are a large enough ledger to deserve their own line: the NRF estimates that 19.3% of online sales will be returned in 2025 [^6], and delivery failures are one of the reasons customers return or dispute.

Only count an order as a successful delivery when the customer received it and kept it. A package that took three attempts still counts if it arrived; a refunded order does not, even if the box was eventually delivered. If you want a single headline number, add Failure Burden to the operating numerator before dividing. But track the two separately first, so you can see which one is actually moving.

Set up a sheet with one row per order and columns for: order ID, carrier, lane, label cost, first-scan time, stalled flag, first-attempt result, final result, support minutes, refund, chargeback, discount. Sum by lane. That single sheet is the engine for every number in this article.

4. Cheap Carrier vs Reliable Carrier

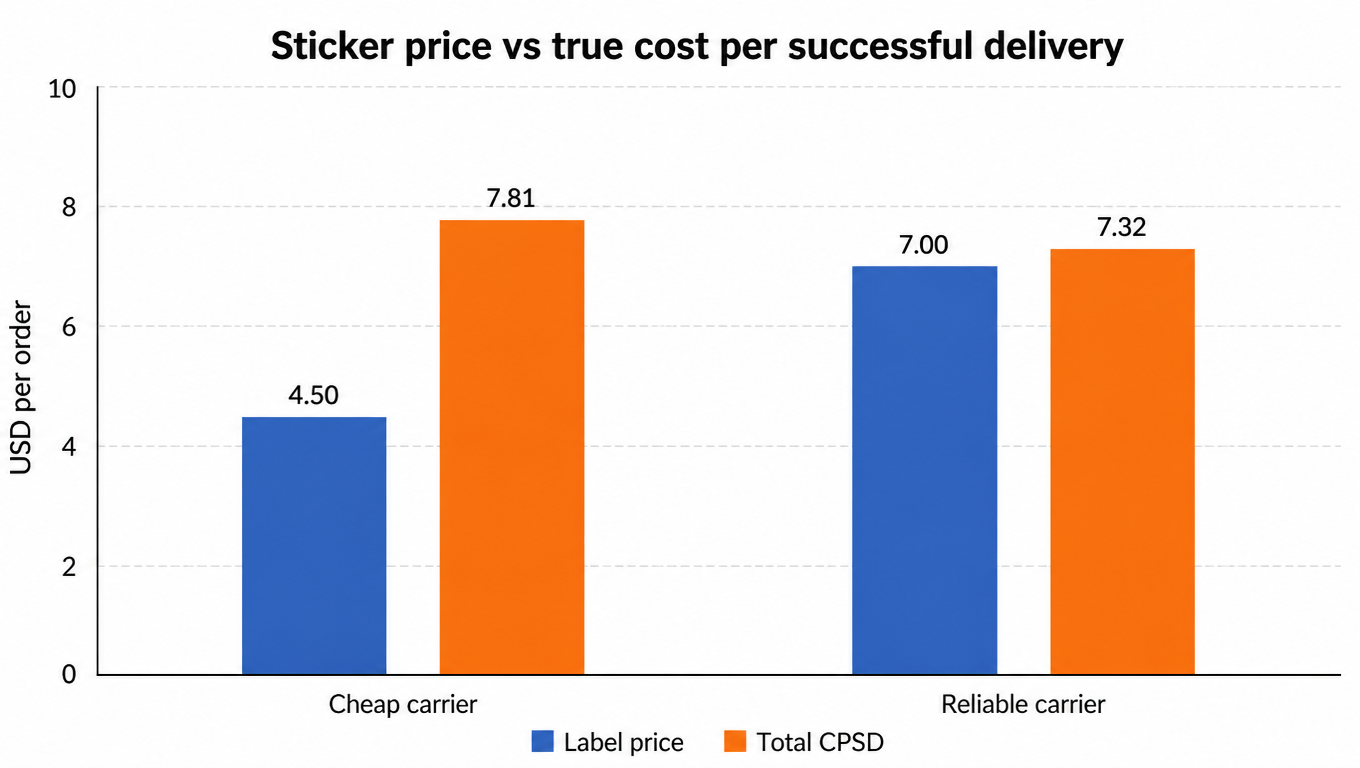
Here are two hypothetical carriers moving the same 1,000 orders in the same month: same product ($40, COGS $8), same customers, same packaging. Only the carrier differs. The cheap carrier charges $4.50 per label, gets a first scan within 24 hours on 85% of packages, lets 12% of shipments stall past 48 hours, completes 88% of first attempts, and ultimately delivers 95% of orders. The reliable carrier charges $7.00 per label, scans 99% of packages within 24 hours, stalls on 2%, completes 97% of first attempts, and delivers 99.5% of orders.

These are modeling inputs only. The added ledger lists assumed costs, refunds, support tickets, and net adjustments so $7.81 and $7.32 can be reproduced; they do not describe actual regional or national carrier performance. Replacing the segment, account terms, costs, and outcomes changes the break-even point.

Bar chart: label price vs total CPSD for cheap and reliable carriers, 4.5 vs 7 label, 7.81 vs 7.32 total CPSD
The sticker price is the beginning; CPSD is the truth (Illustration or assumed example, not a universal carrier rule)

Under these assumed inputs, 1,000 shipped orders produce 950 successful orders for the cheaper-label option and 995 for the higher-label-price option. Combined costs are $7,419.50 and $7,283.40, giving CPSD of $7.81 and $7.32. The $0.49 difference extrapolates to $4,900 per 10,000 successful deliveries. For the same 10,000 shipped orders, the modeled total-cost difference is $1,361. These denominators are not interchangeable, and neither illustration promises savings.

Complete the original example: how the ledgers produce $7.81 and $7.32

This completes the original comparison as an assumed ledger. Charges are not current quotes. The 60 and 6 figures count support tickets, not hours; the negative credit is also a model input, not a received refund. Keep refunds, product loss, and compensation in failure burden without also counting them in operations.

Ledger item (USD)Lower-label-price option (assumed)Higher-label-price option (assumed)
Shipped / successful orders1,000 / 9501,000 / 995
Original labels$4,500.00$7,000.00
Re-send labels (15 × 4.50; 2 × 7)$67.50$14.00
Re-send pick/pack (assumed $2 each)$30.00$4.00
Support tickets (60; 6, assumed $3 each)$180.00$18.00
Return handling (50; 5, assumed $1.50 each)$75.00$7.50
Other net charge / credit (assumed)$197.00-$1.10
Operating cost total$5,049.50$7,042.40
Client refunds (50; 5, assumed $40 each)$2,000.00$200.00
Extra product loss (15; 2, assumed $8 each)$120.00$16.00
Compensation (50; 5, assumed $5 each)$250.00$25.00
Failure burden total$2,370.00$241.00
Combined cost / successful orders$7,419.50 / 950 = $7.81$7,283.40 / 995 = $7.32

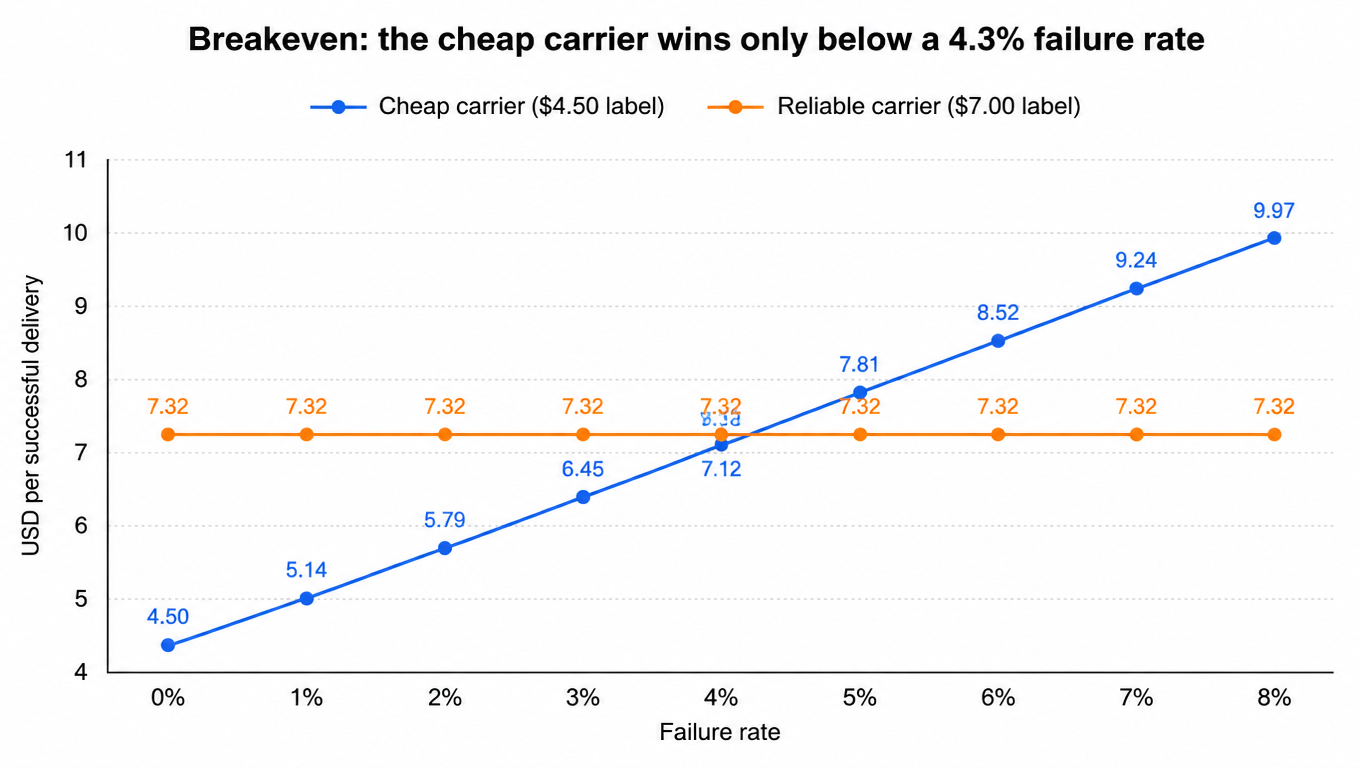
For the cheaper-label illustration, let added cost vary with failed orders at $58.39 each. Combined CPSD(p) = (4.50 + 58.39p) ÷ (1 − p). Against the fixed assumed $7.32, p = (7.32 − 4.50) ÷ (58.39 + 7.32), about 4.29%; the original chart’s 4.3% is its rounded model break-even point. Rebuild the model when fixed fees, support, or refunds change rather than reusing that threshold.

5. The Five Failure Signals to Track

You cannot fix a monthly CPSD number if you are not watching the signals that drive it. Track these five, per lane, every week:

  • No first scan. If no event is visible beyond the agreed observation window, check handoff evidence, scan sources, and event latency. A 24-hour window or 2% alert rate can be discussed as illustrative thresholds, not universal carrier rules. A missing scan alone proves neither non-acceptance nor loss and does not automatically justify a re-send.
  • Tracking upload latency. The gap between the physical scan and the visible scan. A lane whose events appear 12+ hours late hides problems until they are expensive.
  • Tracking stalled. The 48/72-hour windows here illustrate checks, not universal service deadlines. Consider the promise, business days, holidays, and last event before escalating. A stall is not a confirmed failure and does not automatically require a refund.
  • First-attempt delivery failure. Record confirmed causes such as absence, address issues, and signature restrictions with the denominator and period. An 8–20% range can be used in labeled scenarios, not assumed to describe the facility. Test whether communication improves outcomes within comparable segments.
  • Refund and chargeback rate linked to delivery. Split your refunds by reason. When delivery-related refunds move, your CPSD is moving with them.
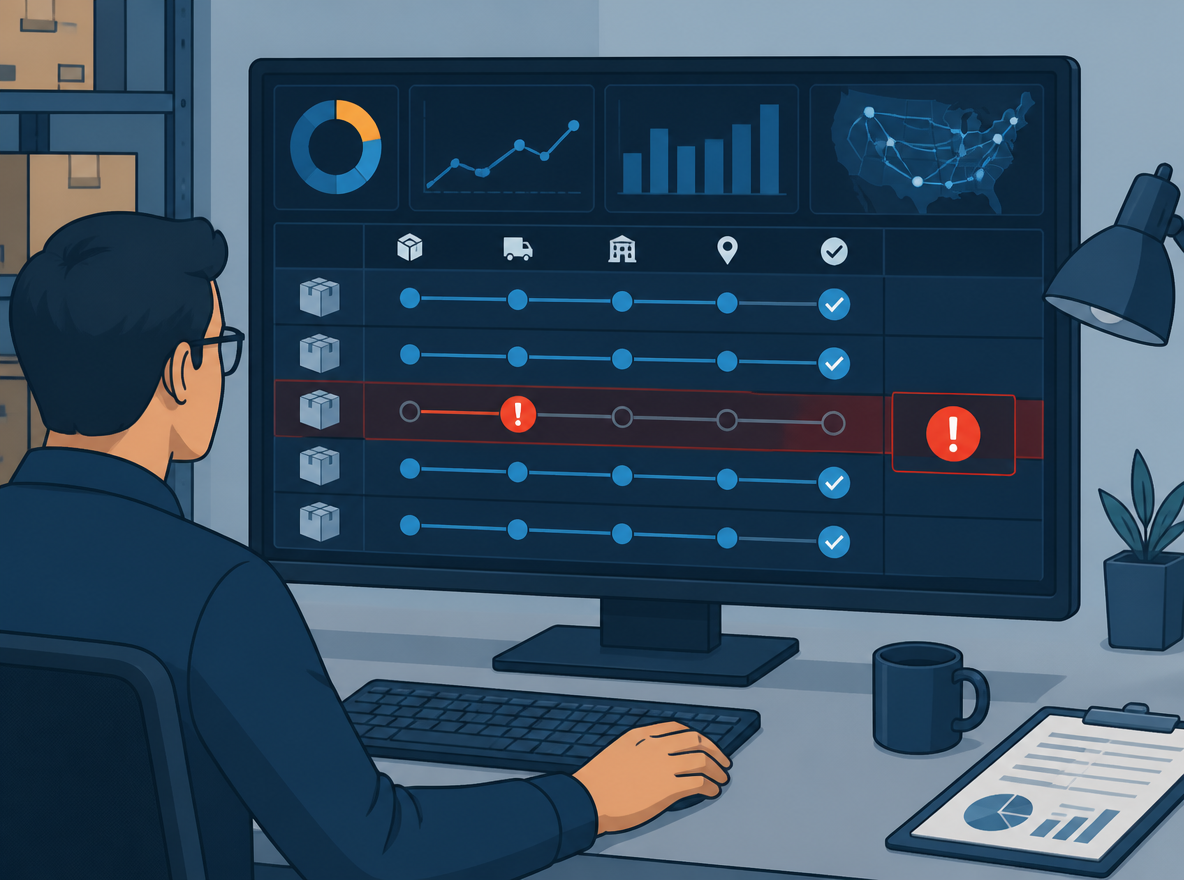
Fulfillment dashboard flags a parcel stalled for 72 hours with a red warning badge.
A stalled parcel needs evidence review before a refund or re-send decision (Illustration or assumed example, not a universal carrier rule)

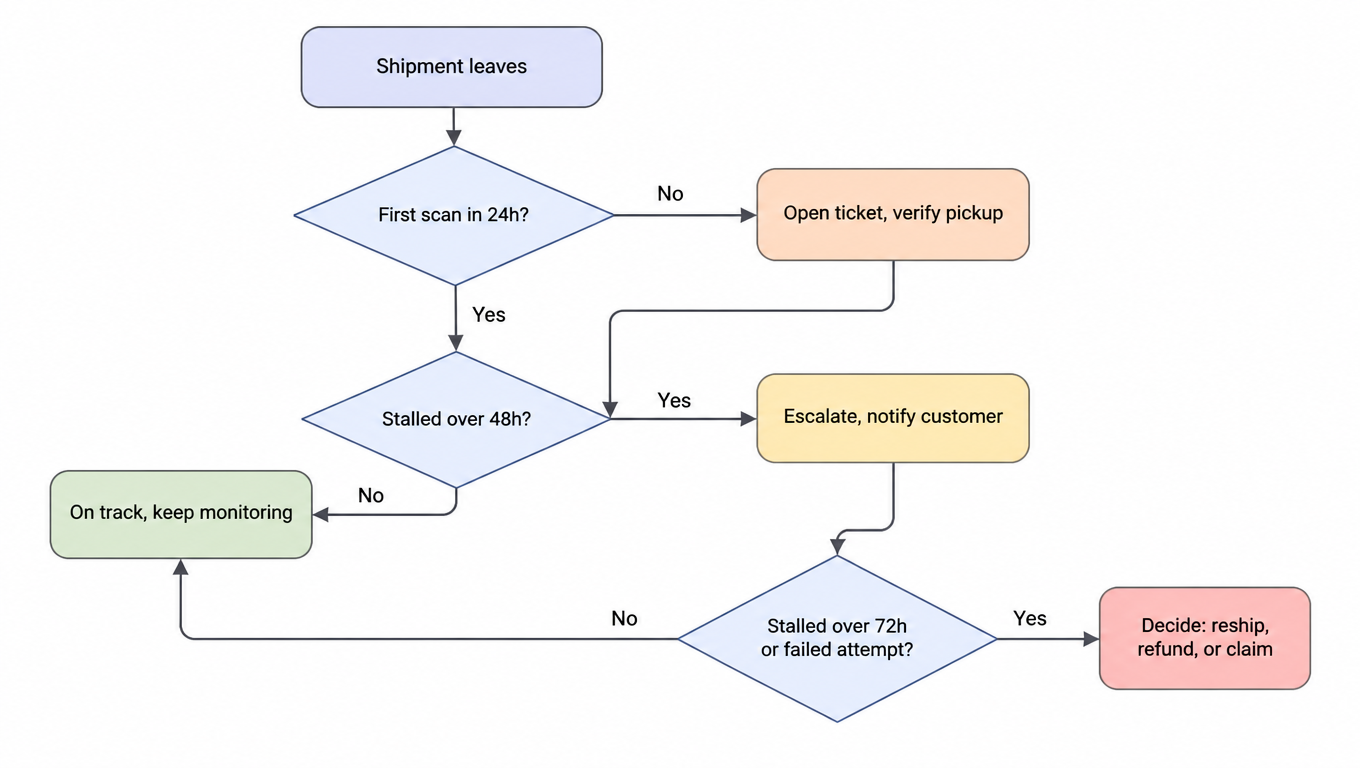
The 24/48/72 ladder below is an adjustable internal example, not carrier policy. Operations, support, and the account owner should approve windows, evidence requirements, and permitted actions before using it. A timer alone must not determine loss, refund, or re-send decisions.

Decision flow: shipment leaves, no first scan in 24h opens a ticket and verifies pickup, stalled over 48h escalates and notifies the customer, stalled over 72h or failed attempt triggers a reship, refund, or claim decision
Ticket at 24h, escalate at 48h, decide at 72h (Illustration or assumed example, not a universal carrier rule)

At 24 hours without a first scan: open a carrier ticket and verify the pickup happened. At 48 hours stalled: escalate with the carrier and notify the customer proactively, before they ask. At 72 hours, or after a failed delivery attempt: make the call. Reship, refund, or file a claim. Do not wait for the customer to force it, because the moment they do, you are paying support time on top of the failure.

6. When Does the More Expensive Carrier Become Cheaper?

Every extra dollar of label price buys something. The question is whether it buys enough. Here is the breakeven for the two hypothetical carriers from the previous section, holding every other variable fixed and letting the cheap carrier's failure rate rise from 0% to 8%.

The cheap carrier's CPSD starts at $4.50 with zero failures and climbs steeply as failures add reshipments, support hours, refunds, and lost product. The reliable carrier's CPSD stays flat around $7.32, because its failure rate barely moves. The lines cross at roughly a 4.3% failure rate. Below that, the $4.50 label wins on true cost. Above it, the $7.00 label is the cheaper delivery.

Line chart: CPSD for cheap and reliable carriers as the failure rate rises, lines cross at roughly a 4.3% failure rate
Below 4.3% the cheap label wins; above it, the pricier label is the cheap one (Illustration or assumed example, not a universal carrier rule)

Most stores never measure their failure rate, so they never know which side of the line they are on. That is the whole point: the cheap label is not the cheap delivery until you have the data to prove it. One way to make the trade concrete for your team is to price the improvement. In the example above, moving from a 4% to a 3% failure rate is worth about $0.67 per order in avoided CPSD. If a lane is running above 4%, paying more per label is not a cost, it is the cheapest fix available.

Verify improvement with comparable segments and separate cost/outcome measures

Compare equivalent clients, facilities, promises, ZIPs, and parcel segments using actual charges and completed observation windows. A lower quote is an estimated signal; a refund on an old invoice is recovery; settled cost for new comparable shipments is the basis for ongoing improvement. If packaging, service, and carrier all change, record them separately instead of attributing the entire result to one action.

Verification lensDefinition and evidenceWhat to keep separate
Cost per shipped parcelAttributable cost divided by parcels shipped, including failed-parcel costs.Do not remove failed parcels to lower the average.
Operational cost per successful deliveryNon-duplicated fulfillment operating cost divided by successfully delivered orders under a stated definition.Multi-parcel orders and re-sends do not automatically become multiple successful orders.
Failure burdenRecord refunds, chargeback fees, unrecovered product loss, and compensation separately.Client refunds are not carrier credits; each cost belongs in one ledger.
Client promise and attributionReview timeliness, first scan, failure reasons, and exception labor alongside cost.A missing scan does not prove loss; a non-delivery-related return does not prove carrier failure.
Completeness and actionRecord open invoices, pending credits, unresolved parcels, and next review.Keep incomplete evidence pending rather than announcing a win or expansion.

When successful deliveries are zero, report the metric as undefined rather than zero cost and explain the scope. Record physical delivery, delivery-related refunds, and unrelated returns separately. State the retained-order convention used in this guide’s original example rather than assigning every return to the carrier. For multi-parcel orders, aggregate all attributable order costs before calculating an order-level metric.

After verification, carry the segment and metric definitions into the carrier performance scorecard for continuing review. If the cause remains unclear, return to the cost triage table. If the cost evidence supports reselection, use the USPS and regional-carrier selection path.

7. A 30-Day Carrier Pilot Template

The 30-day example below organizes baseline, execution, and decisions for one lane or client segment. Its 10–20% allocation illustrates a design, not a universal minimum or recommended quota. Size and duration depend on risk coverage, comparable orders, and the time required to complete invoice observation.

Days 1 to 7: baseline. Pull 90 days of history per lane: label cost, first-scan time, stall rate, first-attempt success, and delivery-related refund and chargeback rates. Compute the CPSD you have today. Pick two or three lanes and one challenger carrier per lane. Write the success metrics down before the first pilot shipment goes out: this is the exit criterion, and it is non-negotiable.

Days 8 to 21: ship the pilot. Route 10% to 20% of each pilot lane's volume to the challenger. Keep everything else identical, same packaging, same support flow, so the only variable is the carrier. Log the five failure signals weekly and compute CPSD per lane at the end of each week.

Days 22 to 30: review evidence. Compare costs and client outcomes for matched segments. Extend observation if charges or parcels remain unresolved rather than forcing a day-30 winner. A 50% allocation and another 30 days illustrate staged expansion only; actual expansion needs confirmed coverage, handoff, costs, and owners.

Never run a carrier change without an exit criterion written first. This pilot is the low-risk pattern from our low-risk shipping rollout guide, applied to a single carrier decision instead of a whole migration.

8. Calculation Definitions and Copy-Ready Worksheets

Most articles end with a call to action. This one ends with assets you can copy, because a metric only helps once it is in your spreadsheet. Here is everything from this article, ready to use:

  1. Copy-ready CPSD formulas. Sum operating cost and failure burden separately using the complete ledger, then divide by the stated successful-order count. Incomplete cost or a zero denominator remains pending or undefined.
  2. Per-order worksheet fields. Copy the calculation section’s order, carrier, lane, charge, scan, outcome, and refund fields; add client, facility, period, open items, and owner. Use measured data in your own Excel or Google Sheets workbook.
  3. Embeddable "Cheap Rate vs True Delivery Cost" chart. The comparison from the carrier section, ready to drop into a board deck, a blog post, or a pitch to your operations lead.
  4. Complete assumed ledger. The two options model 1,000 shipped orders: $4,500 in labels, 50 failed orders, 15 re-sends, and 60 support tickets versus $7,000, 5 failures, 2 re-sends, and 6 tickets. Listed costs and refunds reproduce $7.81 and $7.32. This is a modeled example, not anonymized customer data or a download.
  5. A 24/48/72 discussion ladder. Copy the illustrative windows, evidence, and owners into your own SOP after checking the service and client promise. It is not a separate download or universal refund rule.
  6. A discussion question for your team. "How much would you pay for 1% higher delivery success?" Have everyone write a number down before they see the breakeven chart. The gap between the answers is where the real objections to better carriers live.

The cheapest label is only cheap if it delivers. Measure CPSD, run the pilot, and let the data pick your carriers.

9. TL;DR

  • A label price answers one question: what it costs to hand a box to a carrier. Not whether it arrives, or when.
  • Failures move cost into invisible accounts: support, refunds, chargebacks, reshipments. A $4.50 label can become $18 of operating cost and $53 of failure burden.
  • Keep two ledgers: Operational CPSD = fulfillment operating cost ÷ delivered orders; Failure Burden = refunds + chargebacks + lost product + compensation. Never blend them.
  • A carrier $2.50 more per label can be $0.49 cheaper per successful delivery ($7.32 vs $7.81).
  • Breakeven: below roughly a 4.3% failure rate the cheap carrier wins; above it, the pricier one is cheaper. Measure before you conclude.
  • Watch five signals: no first scan, tracking latency, 48/72-hour stalls, first-attempt failure, and delivery-linked refund and chargeback rates.
  • Switch carriers via a 30-day pilot: 7 days of baseline, 14 days on 10-20% of volume, 7 days of decision, exit criteria written first.
  • One action for today: build the per-order log, compute CPSD by lane, and find out which side of the breakeven line you are on.

FAQ

CPSD compares fulfillment cost with successful orders on a consistent basis. Operating cost includes incurred, non-duplicated picking, packaging, shipping, re-sends, and handling labor. Failure burden separately records refunds, chargeback fees, product loss, and compensation. Apply received carrier recovery once; an unrecovered claim is not an additional expense.
Because failures move cost into accounts the label price never shows: customer-support hours, refunds, chargeback fees, replacement units, and goodwill. A carrier that quotes $4.50 but fails on a meaningful share of volume is not a cheap carrier; it is a $4.50 carrier that invoices the rest of your P&L in failure costs. In this guide's worked example, the $4.50 carrier lands at $7.81 per successful delivery while the $7.00 carrier lands at $7.32, $0.49 cheaper per order.
Set up a sheet with one row per order and columns for order ID, carrier, lane, label cost, first-scan time, stalled flag, first-attempt result, final result, support minutes, refund, chargeback, and discount, then sum by lane. Operational CPSD is total fulfillment operating cost divided by successfully delivered orders. If you want a single headline number, add Failure Burden to the numerator first, but track both ledgers separately so you can see which one is moving.
When its failure rate is low enough that avoided refunds, reshipments, and support outweigh the higher label price. In this guide's breakeven model the cheap carrier's CPSD climbs from $4.50 at zero failures and the reliable carrier holds flat near $7.32; the lines cross at roughly a 4.3% failure rate. Below it the $4.50 label wins on true cost, above it the $7.00 label is the cheaper delivery. Most stores never measure their failure rate, so they never know which side they are on.
Monitor missing first scans, event-upload latency, stalls, first-attempt failures, and delivery-related refunds/chargebacks. The 24/48/72-hour windows are illustrative. Use the promise, handoff evidence, and confirmed cause before owners decide to escalate, re-send, refund, or claim.
Does recovering an old charge prove ongoing improvement?

No. Report one-time recovery separately from recurring cost movement on new shipments. Compare settled cost, delivery, and exceptions for comparable segments before expanding or continuing observation.