Ecommerce Shipping Guide

Ecommerce Shipping Capacity Planning: What Breaks First When Order Volume Doubles?

Doubling order volume is the problem every ecommerce team wants. But anyone who has lived through it knows the truth: growth does not spread evenly across days, and it does not land evenly across steps. It usually shows up on a Friday afternoon as a few hundred orders still unlabeled at cutoff. This guide answers two questions: which link in your shipping chain breaks first when volume doubles, and how to find that link with a stress test before it actually breaks.

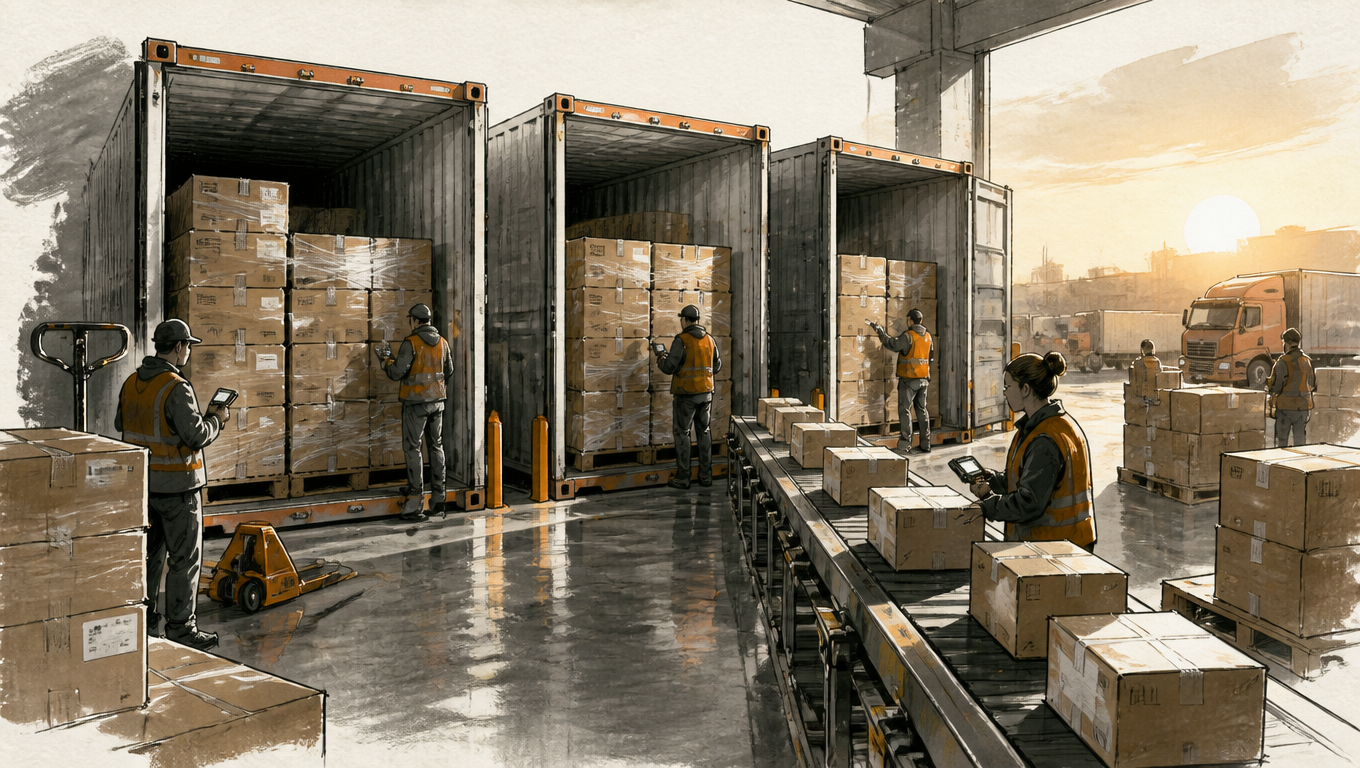
Shipping supervisor checks a stack of labels between a packing station and label printer.
Growth does not land evenly across links; it lands on the weakest one.

Symptoms: The Red Lights Your Team Sees Before Volume Doubles

Growth is great, until fulfillment stops keeping up. The first signal is orders that never clear before the afternoon cutoff, overtime that becomes the norm, and then the realization that the same shipping work needs more people every day. That is usually not an attitude problem. It is a step in the process that quietly hit its ceiling.

The subtler signals hide in the systems. Rate comparison and label creation start to queue, and a single rate lookup spins for seconds. Inventory, order, and tracking disagree with each other, and the same order shows different progress on different screens. Your primary carrier's pickup window no longer fits all the packages, so you split handoffs into two batches a day and worry the second one misses the scan.

Warehouse staff work at a printer and packing bench as a wall clock approaches closing time.
When orders concentrate in the final two hours, all the pressure lands on the warehouse right before close.

Go one level deeper, and exceptions, WISMO[1] (where is my order) contacts, and reconciliation work grow faster than orders themselves. The daily average looks fine, until a promotion day (Prime Day, Black Friday) hits and everything breaks at once: peak season volume can run 3 to 5 times normal[2].

At this point the usual conclusion is "we don't have capacity." But nobody can say what kind: warehouse, people, printers, carriers, or systems? This guide breaks the problem into a Shipping Capacity Chain and gives you a Double-Volume Stress Test, so you know which link breaks first before the volume actually doubles.
Why "How Many Shipments Per Day" Lies to You

Traditional capacity planning measures how many shipments you can produce per day. The number is not wrong, it is just an average, and capacity problems almost always happen at the peak. Capacity should be sized against your peak, not your daily average[3]. The daily average systematically hides these variables:

  • whether orders concentrate in the final two hours (the peak-to-average ratio);
  • lines per order and split shipments;
  • how many marketplaces you connect to, each with its own rule count;
  • package size and service complexity (oversize, multi-piece, international);
  • the share of manual overrides and rework;
  • carrier pickup cutoffs;
  • API latency and failed retries (do retries print duplicate labels);
  • how much downstream work returns, exceptions, and billing create.

None of these variables shows up in "shipments per day." For example, a system averaging 300 orders a day might see 80 percent of them land in two afternoon hours; the instantaneous throughput demand is four to five times the average.

So hiring more people often does not fix it, for four reasons. Data problems are not fixed by more staff: if the states disagree, ten more people still disagree. Carrier capacity does not grow because the warehouse has one more person: UPS picks up at 4 p.m., and missing that window means a single late pickup, not a carrier that waits two extra hours for your overtime[4]. Wrong rules just execute faster: with a broken SOP, more people make the same mistake faster. Software and API bottlenecks stay put: a label system that prints three labels a second makes everyone queue.

The conclusion: capacity is not a number, it is a chain. The chain's real capacity is not the average of its links, it is the weakest one. That is the core of the Theory of Constraints: system throughput is set by the bottleneck, not by the best-performing step[5].

The Shipping Capacity Chain: Seven Links

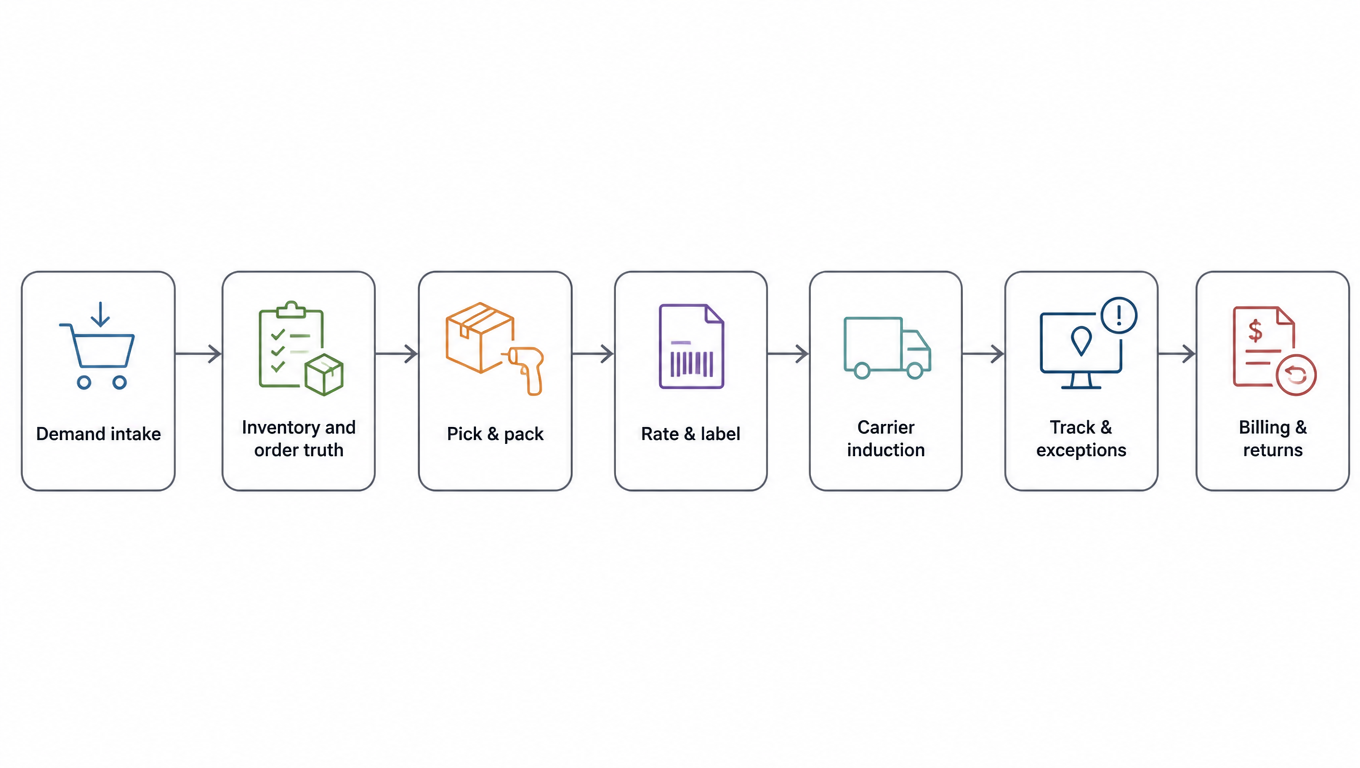
Slice the flow from order intake to settled bills into seven links. Any of them can become the bottleneck:

Flowchart: demand intake, inventory and order truth, pick and pack, rate and label, carrier induction, tracking and exceptions, billing and returns, seven links in sequence
Seven links: the chain is only as strong as its weakest link.

Each link's job and its typical bottleneck signals:

  • Demand Intake: syncing orders from marketplaces and channels. Bottleneck signals: sync lag, duplicate orders, and missing fields that break downstream steps.
  • Inventory & Order Truth: the single source of truth for inventory, orders, and what can ship. Bottleneck signals: overselling, inconsistent states, manual edits.
  • Pick & Pack: the human work of picking, packing, weighing, and labeling. Bottleneck signals: growing queues, rising mispick rates, more overtime.
  • Rate & Label: comparing rates, choosing a service, generating labels. Bottleneck signals: rate lookups queueing, slower label creation, more manual overrides.
  • Carrier Induction: handoffs, consolidation, and turning packages over to the carrier. Bottleneck signals: missed cutoffs, daily pickup caps, forced split handoffs. Capacity investment in this link decides your last-mile cost and experience; see our guide on the true cost of last-mile delivery.
  • Tracking & Exceptions: scans, tracking, exception handling, WISMO. Bottleneck signals: exceptions spiking, more customer questions, support queues.
  • Billing & Returns: invoice reconciliation, returns, refunds. Bottleneck signals: reconciliation backlog, more billing adjustments, slower refunds.

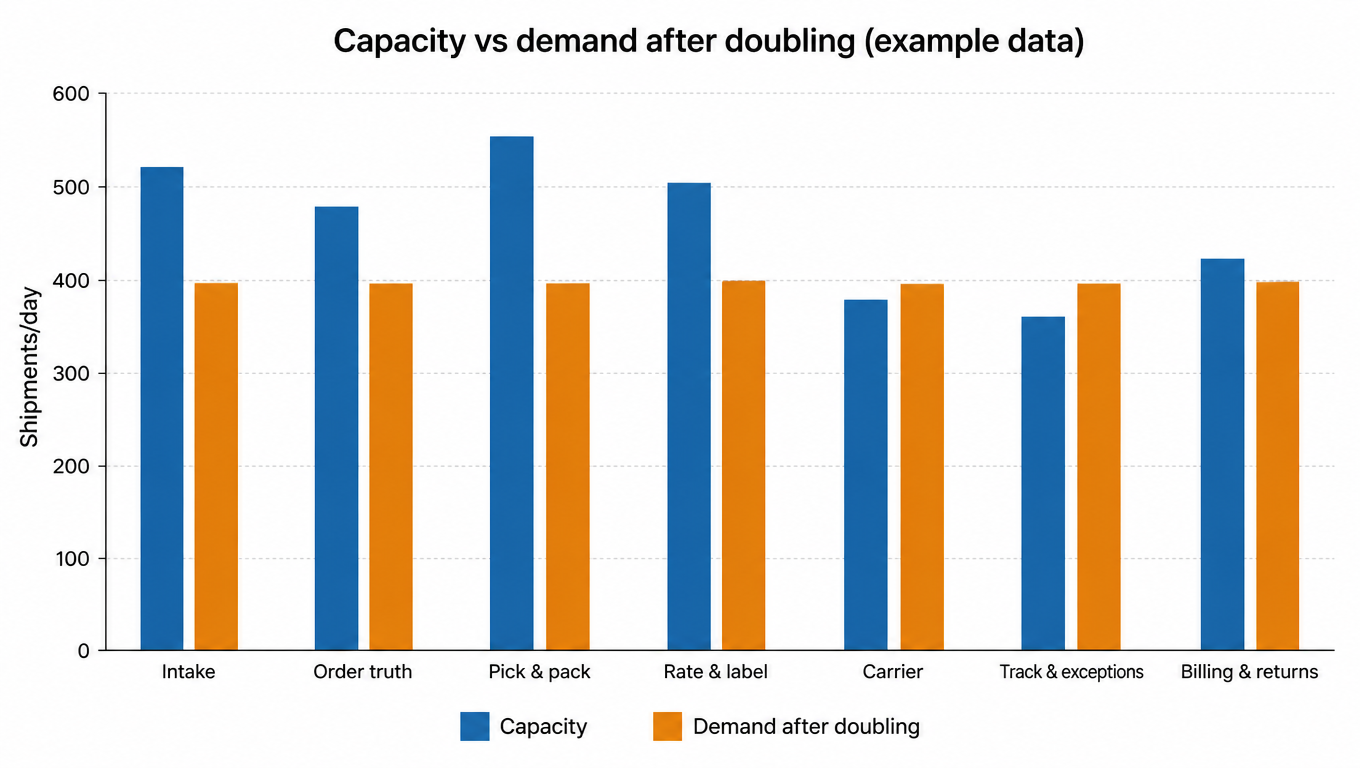
The core principle: do not upgrade the most visible link, upgrade the one that actually limits throughput. As a hypothetical example, say demand after doubling is 400 shipments a day, and link capacity is 520 for intake, 480 for order truth, 560 for pick and pack, 500 for rate and label, 380 for carrier induction, 360 for tracking and exceptions, and 420 for billing and returns:

Bar chart: demand after doubling (400 shipments/day) against link capacity; carrier induction at 380 and tracking and exceptions at 360 fall below the demand line, pick and pack at 560 is highest
Demand after doubling vs link capacity (example data)

In this example, pick and pack looks the busiest (largest capacity, most visible), but it is not the bottleneck. The real constraints are carrier induction (380) and tracking and exceptions (360), both below the 400 demand line. Adding people and a table to the packing bench would upgrade the most visible link; the correct moves are a second carrier and automated exception handling. Note: these numbers only demonstrate the method. Your real thresholds must come from your own baseline, SLA, and margin requirements, not from any industry-wide number.

Key Variables: Break Capacity Into Five Measurable Groups

Bottleneck signals are qualitative. Before choosing a fix, break capacity into measurable variables, in five groups:

Group Key variables Why it affects capacity
Order loadaverage orders/day, peak orders/hour, peak-to-average ratio, marketplace/channel mix, lines per order, split shipment rateshapes the demand curve; the higher the peak-to-average ratio, the more short-burst throughput matters
Warehouse executionlabor minutes per order, pick/pack queue length, rework and mispick rate, missed cutoff rate, backlog agesets how steeply labor cost rises as orders grow
Shipping techmanual rate decisions per order, label creation throughput, API latency/error rate, retry and duplicate-label behavior, manual override rate, batch processing capacitysets how many multiples of growth the automation can absorb
Carrier capacitypickup cutoff, daily acceptance/capacity limits, active carrier count, ZIP/service coverage, package and zone mix, fallback readinesssets how many packages can physically leave
Downstream worktracking exceptions, WISMO contacts, RTS/reship/refund, billing adjustment volume, reconciliation time per shipmentsets whether back-office headcount explodes with orders

Put these five groups into a weekly tracking sheet, draw each link's capacity against demand the way the chart above does, and capacity planning stops being a feeling and becomes a measurement. The first move per group: define your own normal range and alert line for every variable. That beats any industry benchmark.

The Double-Volume Stress Test: Find the Link That Breaks First

The method is direct: build the baseline on your own data from the last 30 to 90 days of real orders, then simulate four scenarios. Why real orders? Only real data carries your channel mix, package profile, and time-of-day distribution. Invented numbers give you the wrong answer.

The four scenarios:

  • Scenario 1, plain doubling: double the baseline daily average and walk each link to see where the backlog appears first.
  • Scenario 2, compressed window: squeeze the doubled volume into the busiest two to three hours to simulate a promotion day.
  • Scenario 3, primary carrier down: assume the main carrier is unavailable for a day and check whether fallbacks absorb the volume.
  • Scenario 4, tech layer degrades: assume one layer (shipping, WMS, API) slows or fails more often, and watch whether retries and queues drag the whole chain down.

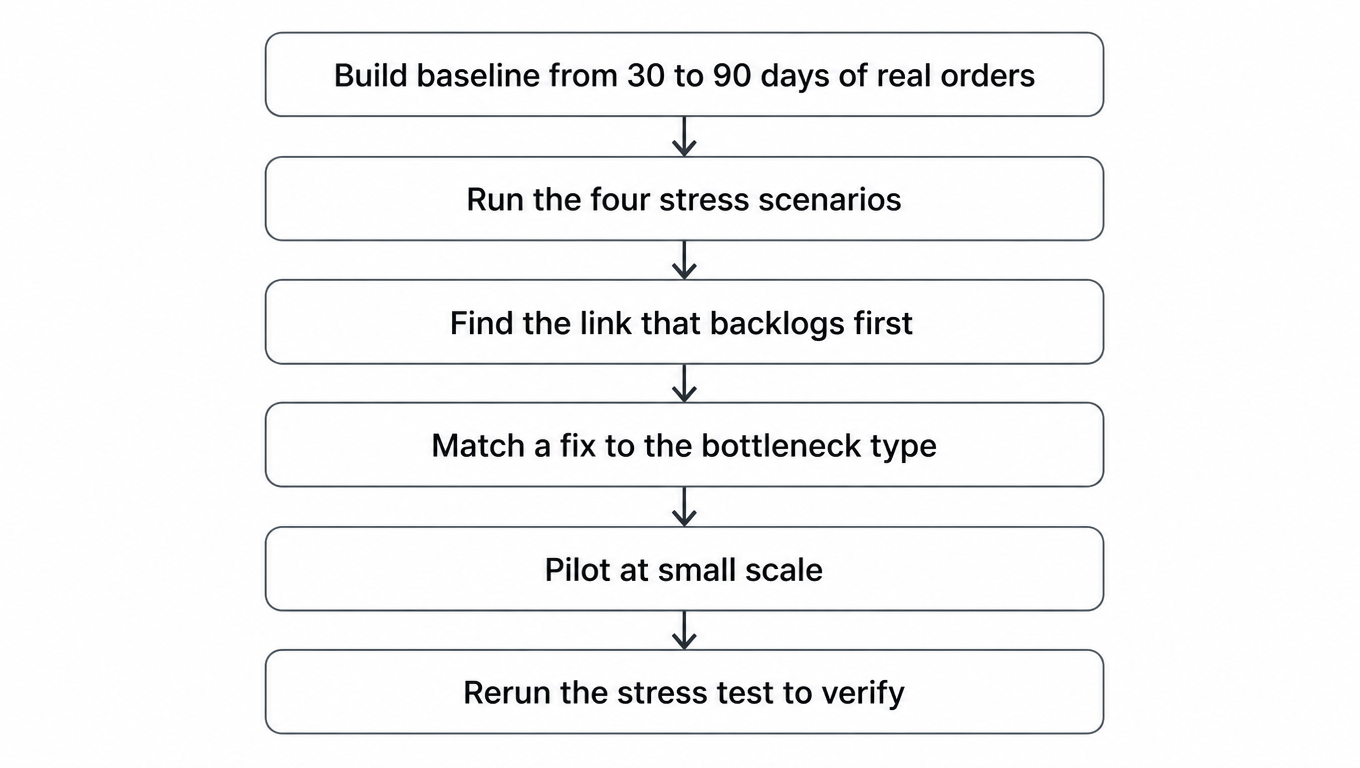
Each scenario has one goal: find the link that backlogs first. Then match the fix to the bottleneck type:

  • Labor bottleneck: layout, SOP, shifts, or hiring.
  • Rate and label bottleneck: batch workflows, Portal, Excel, or API. For the break-even math on automating rate shopping, see our rate shopping automation break-even guide;
  • Carrier bottleneck: multi-carrier, regional options, a capacity plan. To add a second carrier systematically, start with our multi-carrier shipping strategy guide, then check when a regional carrier saves money and carrier redundancy design;
  • Data bottleneck: define the source of truth, fix the integration.
  • Facility bottleneck: 3PL, multi-warehouse, or a new site.
  • Exception bottleneck: exception automation and clear ownership.
Flowchart: build a baseline from 30 to 90 days of real orders, run the four stress scenarios, find the link that backlogs first, match a fix to the bottleneck type, pilot at small scale, rerun the stress test to verify
The stress test loop: find the bottleneck, fix it by type, pilot small, then rerun.

The final step: pilot at small scale, confirm the fix actually raised that link's capacity, then rerun the stress test. Capacity planning is not a one-time project; it is a loop you rerun every quarter and every time growth expectations change. Set every threshold from your own baseline, SLA, and margin requirements. This guide gives no universal numbers, because universal numbers are the mistake.

Summary: Capacity Is a Chain Problem, Not a Daily-Average Problem

Doubling volume does not land evenly across links; it lands on the weakest one. Daily averages are averages. Capacity is a peak problem and a chain problem. Hiring, switching carriers, or upgrading software: no single move is guaranteed to fix it. Find the link that breaks first, then decide where to spend the effort.

If you want to start tonight: run the four stress scenarios on your own data from the last 90 days and find the first link that backlogs; pick one fix by bottleneck type and pilot it small; put the five variable groups into weekly tracking. On the tooling side, rate comparison, batch label printing, multi-carrier switching, and exception alerts are exactly what an automation layer should carry for you. Leave the human hours for the decisions that actually need judgment.

Want to know which link breaks before volume doubles?

EasyShippingX delivers multi-carrier real-time rate comparison, batch label printing, labels, and tracking. Rate and label decisions run in batch with automatic carrier selection, routing rules can hold pre-set fallbacks, multiple carriers run in parallel at peak, and exception and tracking alerts triage automatically. The two most common bottleneck classes, rate and label and carrier, no longer have to be carried by people. See pricing or book a demo.

FAQ

There is no universal answer, but the two most common constraints are carrier induction (capped by physical capacity and pickup cutoffs) and tracking and exceptions (which grow with volume and amplify upstream backlogs). To confirm yours, run the four stress scenarios on 30 to 90 days of real orders and watch which link backlogs first.
Because the average hides concentration. When 80 percent of orders land in the busiest two or three hours, instantaneous throughput demand can be four to five times the daily average, and anything sized to the average tops out in that moment. Size capacity to the peak, not the average.
Four cases: more staff cannot make disagreeing data agree; carrier capacity does not grow because the warehouse has one more person; a wrong SOP just executes faster; and a software or API throughput ceiling queues everyone anyway. Classify the bottleneck as labor, decisions, carrier, data, facility, or exceptions before you hire.
Quarterly, plus every time growth expectations, carrier structure, or channel mix changes. After each run, pilot the fix at small scale and rerun the stress test to confirm the bottleneck actually moved. Capacity planning is a loop, not a one-time project.