Ecommerce Shipping Guide

When Should You Automate Rate Shopping? A Break-Even Framework for Ecommerce and 3PLs

Rate shopping is the quiet lever in shipping cost control. Every order is a decision about which carrier to use, which service, which zone, and which price to pay. Do it by hand long enough and it becomes invisible labor: minutes per shipment, dollars per hundred, eroded margins per quarter. This article builds the math that tells you exactly when automation pays for itself, with worked examples for an ecommerce brand and a small 3PL, and a phased roadmap that starts in a portal and moves to the API only when the numbers say so.

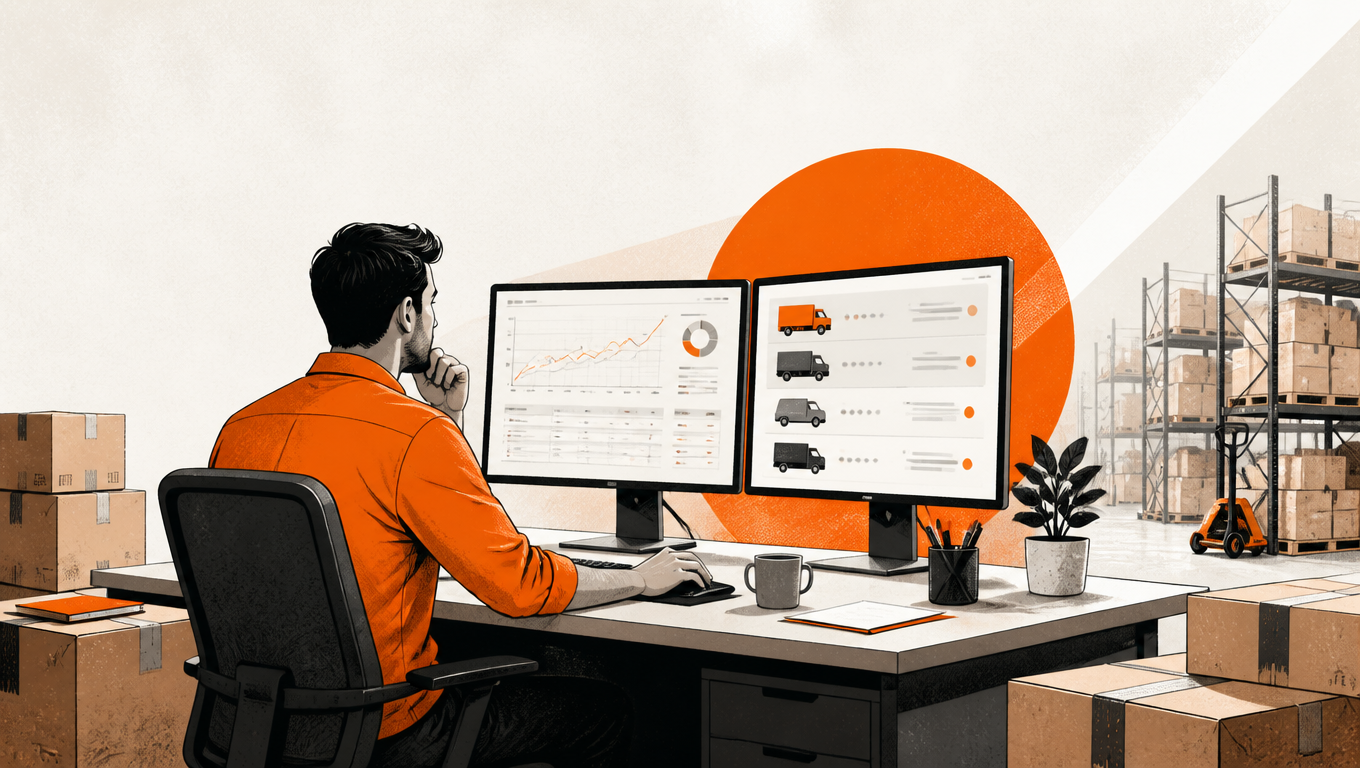
Warehouse operator compares rates on two monitors beside shipping boxes.
Every order is a carrier decision, and manual rate shopping is invisible labor

Why Rate Shopping Automation Is Becoming Table Stakes

Rate shopping means comparing live rates from each carrier before every shipment is labeled, then choosing the cheapest or best-fit option: USPS versus a regional carrier, ground versus expedited, negotiated discount versus published price. Done well, it saves a few dollars per package on every order where the cheapest option is not the default one.

The rate landscape has made manual comparison steadily harder. Base rates, fuel surcharges, dimensional weight pricing, zone-based tables, and regional carrier discount structures now interact in ways that a single printed rate sheet cannot capture. For example, a rate that wins for a 2-pound package to zone 5 loses to a regional carrier for a 9-pound package to zone 8. The best answer changes package by package, and it changes as carrier tariffs update, which they do frequently.

Manual comparison worked fine at low volume, when an owner could check two or three carriers for a few dozen orders a day. It stops scaling the moment orders grow, staff multiply, or peak season doubles the volume. At that point the industry has moved on: rule-based and automated rate shopping is shifting from a competitive advantage to a baseline expectation[1]. Fulfillment software, shipping platforms, and 3PL systems now expose rate comparison as a built-in feature, not a premium add-on. Consider a seller shipping a few hundred orders a day: manual rate shopping eats over a dozen hours a week hopping between carrier portals, and the same workload takes minutes once automated.

The cost of standing still is a few dollars per shipment, compounded across thousands of shipments. That is the whole story of this article: small per-package differences, multiplied by volume, decide whether a shipping operation is profitable or just busy. For the broader cost framework, start with our guide on how to lower shipping costs.
The Manual Rate Shopping Cost Model

Before you can decide whether automation pays, you need an honest number for what a manual rate check costs. Count the full cycle: open the carrier portal or shipping platform, log in, enter the package dimensions and destination, read the quoted rate, mentally compare it against the other carrier options you maintain, then purchase the label. For a practiced operator this takes about two minutes per shipment; for a busy or less experienced one, longer[2].

That time translates into money through a simple formula:

  • Per-shipment manual cost = time per check × loaded hourly labor cost
  • Monthly manual cost = per-shipment cost × monthly shipment volume

Take an example with a loaded labor cost of $25 per hour (wage plus benefits, taxes, and overhead): a two-minute check costs about $0.83 per shipment. At 500 shipments a month, that is roughly $417 a month of pure labor spent on comparing rates. At 5,000 shipments a month, the same per-shipment cost becomes $4,167 a month, which is a full-time position's worth of rate shopping and nothing else.

Two costs sit outside that formula and are easy to undercount. The first is opportunity cost: every minute spent in a carrier portal is a minute not spent packing, handling an exception, or answering a customer question. The second is consistency cost: without a documented rule for choosing a carrier, different staff members pick different carriers for identical shipments, and no one can later explain why a choice was made. Both are real, and both disappear when the decision is automated.

The Break-Even Framework

Automation has its own cost structure, and the break-even framework simply puts the two sides on the same page:

  • Automation fixed cost = subscription or API fees, plus integration effort amortized over 12 months, plus ongoing maintenance
  • Manual cost = per-shipment manual cost × monthly volume
  • Break-even volume = automation fixed cost ÷ per-shipment savings
  • Per-shipment savings = saved labor time + average rate discount from better carrier choice

The per-shipment savings figure is the heart of the framework, and most sellers understate it because they only count the labor. When automation picks a cheaper carrier on a share of shipments, the average rate discount belongs in the equation too[3]. In the worked examples below, labor savings and rate savings contribute comparable amounts, and the break-even volume roughly halves compared with counting labor alone.

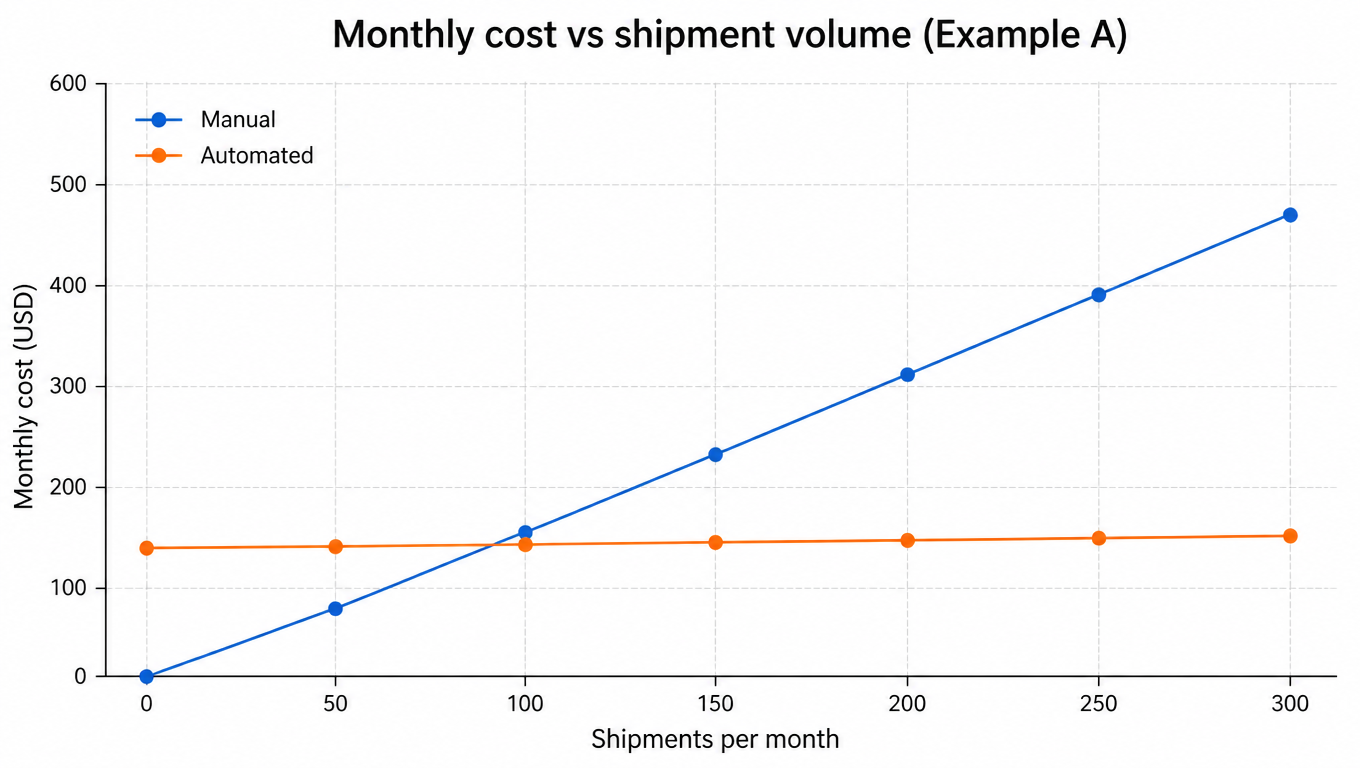
Line chart: monthly cost vs shipment volume, manual cost grows linearly, automated cost stays nearly flat, crossover just above 90 shipments (example data)
Monthly cost vs shipment volume for a typical DTC brand: the crossover sits just above 90 shipments (example data)

The chart below shows the two cost lines for the example DTC brand: manual cost grows linearly with volume at $1.58 per shipment (labor plus average rate discount), while automated cost stays nearly flat at about $140 a month. The lines cross just above 90 shipments a month. The break-even point is almost always lower than sellers expect, because both time savings and rate savings count. Below the crossover, automation is a monthly expense you could skip. Above it, every shipment adds to the savings gap, and the gap widens as volume grows.

Worked Examples: Ecommerce Brand vs 3PL

Example A: a DTC brand at 500 shipments per month. The owner spends two minutes per manual check, loaded labor at $25 per hour, so the per-shipment labor cost is $0.83. Automated rate shopping also wins an average rate discount of $0.75 per shipment by catching regional carrier advantages and better service selections. Total per-shipment savings: $1.58. The automation tool costs $99 a month in subscription plus a one-time $500 integration amortized over 12 months, about $42 a month, for roughly $140 a month in fixed cost. Break-even volume is $140 ÷ $1.58, about 89 shipments per month. At the brand's actual 500 shipments a month, automation nets about $650 a month after covering its own cost.

Example B: a small 3PL at 5,000 shipments per month across multiple clients. Operators are more practiced and the process is semi-systematized, so a manual check takes one minute, $0.42 per shipment in labor. The rate discount matters more here because the 3PL can layer regional carrier agreements across client volumes, averaging $1.20 per shipment. Total per-shipment savings: $1.62. API-level automation costs $500 a month plus a $3,000 integration amortized over 12 months, about $750 a month in fixed cost. Break-even volume is $750 ÷ $1.62, about 463 shipments per month, less than a tenth of the 3PL's actual volume. At 5,000 shipments a month, automation nets roughly $7,350 a month.

Metric Example A: DTC brand Example B: small 3PL
Monthly volume500 shipments5,000 shipments
Manual time per check2 minutes1 minute
Per-shipment labor cost$0.83$0.42
Average rate discount$0.75$1.20
Per-shipment savings$1.58$1.62
Automation fixed cost~$140/month~$750/month
Break-even volume~89 shipments/month~463 shipments/month
Net monthly savings at actual volume~$650~$7,350

Sensitivity is where the framework earns its keep. Consider Example A with a rate discount of only $0.25 instead of $0.75: per-shipment savings drop to $1.08 and break-even rises to about 130 shipments a month, still far below the brand's volume. If Example B's API subscription is $800 a month instead of $500, break-even rises to about 494 shipments, still a rounding error against 5,000. The conclusions are robust: volume far above the crossover makes the decision easy, and only near the crossover do you need to sharpen the assumptions.

The takeaway across realistic assumptions: most sellers reach positive ROI well before they think they will. With conservative assumptions, higher fixed costs and thinner savings, the payback threshold typically lands in the 300 to 500 shipments per month range. With realistic assumptions, many operations pay back well under 300, sometimes under 100.

The Hidden Costs of Not Automating

Automation decisions are usually framed as what will this cost me. The more expensive question is what am I already paying by not automating. Several costs never show up as a line item, which is exactly why they persist.

Missed carrier discounts and regional carrier rate advantages are the biggest one. A regional carrier can undercut USPS or FedEx by 15 to 30 percent on qualifying lanes, but that advantage only materializes if someone actually checks those lanes on every shipment[4]. A manual operation checks the lanes it remembers, not the lanes that win today. For a data-driven view of which lanes actually win, see our guide on when regional carriers save money.

Human error compounds the miss. Wrong service selection, address mistakes, and reprinting labels cost both money and time, and they spike under pressure. During peak season, when volume doubles and headcount cannot, the manual process degrades exactly when the stakes are highest. The bottleneck stops being shipping volume and becomes the number of hands available to click through carrier portals.

For 3PLs there is also an audit and competitive dimension. Without a data trail of rate decisions, there is no way to verify carrier invoices, reconcile disputes, or prove to a client that their shipments were priced on the best available option. Clients increasingly expect a defensible cost structure, and a 3PL that cannot show one loses the quote. For scoring carriers on data and for squaring quotes against final charges, see our carrier performance scorecard and rate quote vs. final charge guides.

Portal-First, API-Later: The Phased Roadmap

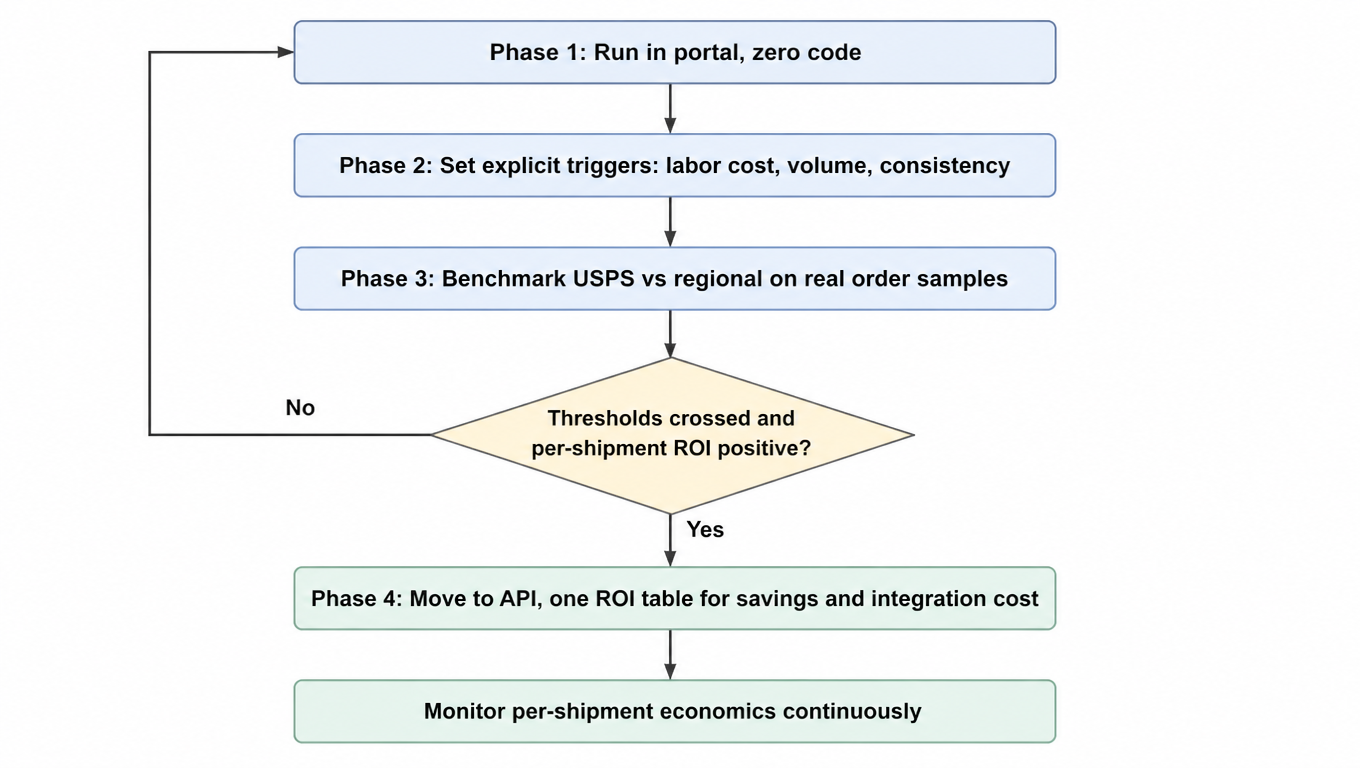
Automation does not have to be a big-bang integration project. The cheapest way to start is in the portal: most shipping platforms and tools already include built-in rate comparison across the carriers you use. Zero code, low commitment, and good enough to validate the numbers at low volume. Phase 1 is exactly that: run in the portal, watch what the tool would have chosen versus what staff chose, and let the break-even math above tell you whether the difference is worth chasing.

Phase 2 is setting explicit triggers for the move to API. Three thresholds matter: per-shipment labor cost, monthly volume, and consistency. When the portal's rate suggestions reliably beat manual choices, when volume approaches the break-even crossover, and when staff inconsistency starts costing visible money, the case for API automation is already made. Write the thresholds down before you build anything.

Phase 3 is benchmarking real order samples against the carrier options you would actually use, USPS versus regional carriers on the lanes you actually ship. A few hundred historical orders are enough to estimate the average rate discount honestly, and that number is the single most important input to the break-even calculation.

Phase 4 is the API move itself, with carrier savings and integration cost on the same ROI table, denominated in per-shipment economics. Every line item, subscription price, integration hours, maintenance, and discount should be expressed per shipment so the table stays comparable as volume changes. Once you are in the API, our sister guide on automating carrier selection without breaking service promises keeps automation from eroding what you promised customers.

Flowchart: Phase 1 run in portal zero code → Phase 2 set explicit triggers (labor cost, volume, consistency) → Phase 3 benchmark USPS vs regional on real samples → thresholds crossed and per-shipment ROI positive? No loops back, Yes moves to Phase 4 API with one ROI table and continuous monitoring
Portal-first, API-later: thresholds and per-shipment ROI decide when to upgrade

The discipline that makes the roadmap work is the per-shipment denominator. Any ROI table that mixes monthly subscriptions, one-time integrations, and per-package savings without converting them to a common per-shipment basis will mislead you. Do the conversion, and the decision at every phase becomes arithmetic.

When NOT to Automate

A framework that says automate everything is not a framework, it is a sales pitch. There are legitimate cases where manual rate shopping is the right call, and naming them makes the break-even math more credible, not less.

Automation does not pay when monthly volume is so low that the fixed cost never gets covered. Below roughly 50 to 100 shipments a month, a $140 monthly subscription is hard to justify on savings of a dollar or two per package. It also does not pay when shipping cost is not a material part of the cost structure, or when you ship on a single carrier with a simple rate table and there is no meaningful choice to make. For example, if every order goes USPS Priority with a flat negotiated rate, there is nothing to shop.

The last boundary is operational. Automation tooling needs someone to configure rules, monitor rates, and fix it when a carrier tariff change breaks an assumption. If there is no operational capacity to maintain the tooling, the automation decays into a more expensive manual process with a veneer of automation on top.

Bottom Line

The decision table below compresses the framework into a starting point. Let your own numbers, not the table, make the final call.

Monthly volume Typical situation Recommendation
Under ~100 shipmentsFixed cost likely exceeds savingsStay manual, use built-in portal rate comparison
~100 to ~300 shipmentsNear or past break-even under realistic assumptionsRun portal-based comparison, start benchmarking samples
~300 to ~500 shipmentsConservative break-even rangeBuild the ROI table, plan the API move
Over ~500 shipmentsWell past break-even; hidden costs compoundingMove to API automation, monitor per-shipment economics

The question for a growing ecommerce brand or a small 3PL is not whether to automate rate shopping. It is when. The answer lives in three numbers you can gather this week: minutes per manual check, shipments per month, and the average discount a better carrier choice would earn. Put them into the break-even formula, and the decision stops being a hunch and becomes arithmetic. To run your own numbers through the framework quickly, try our shipping cost optimization advisor.

Want to see what automated rate shopping saves you?

EasyShippingX's Shipping API delivers multi-carrier real-time rate comparison, labels, and tracking with transparent per-shipment pricing: fill your manual check time and average rate discount into the break-even formula, compare against the API cost, and the crossover volume is right there. See pricing or book a demo.

FAQ

There is no universal answer, but the framework is stable: break-even volume = automation fixed cost ÷ per-shipment savings. Under conservative assumptions the payback range is 300 to 500 shipments a month; under realistic assumptions many operations pay back under 300, some under 100. Below roughly 50 to 100 shipments a month the fixed cost rarely gets covered, and built-in portal comparison is the better call.
It depends on three thresholds: per-shipment labor cost, monthly volume, and comparison consistency. At low volume and in testing, the portal is enough with zero code. When the portal's suggestions reliably beat manual choices, volume approaches the crossover, and inconsistency starts costing visible money, move to the API. The roadmap is portal-first, API-later, not a big-bang.
Counting only the saved labor time and missing the average rate discount. The discount from automation picking cheaper carriers on a share of shipments is roughly half of the per-shipment savings, and skipping it roughly doubles the estimated break-even volume. The second most common error is mixing monthly subscriptions, one-time integrations, and per-package savings without converting to a common per-shipment basis.
No. Regional carriers can be 15% to 30% cheaper than USPS or FedEx on qualifying lanes, but the advantage is unevenly distributed by lane, weight band, and destination. Because the per-parcel answer varies, automation or at least portal comparison is what captures the advantage consistently. Benchmark a few hundred historical orders on the lanes you actually ship to get an honest average discount.
Integration cost is usually one-time engineering hours plus ongoing maintenance, amortized over 12 months into the automation fixed cost. In this article's examples: a DTC brand's one-time $500 amortizes to about $42 a month, and a 3PL's $3,000 to about $250 a month. Timeline depends on your existing stack, with a few weeks being typical. What matters is not the absolute number but putting it on the same per-shipment ROI table.