3PL Guide

How to Build a Carrier Strategy for an Ecommerce Fulfillment Center

For operations managers at 3PLs and independent fulfillment centers, freight is usually the second-largest cost after labor, sometimes the largest. Yet most run it passively: sign whatever discount the carrier offers, allocate volume by habit, eat surprise peak surcharges, and settle problems by phone and luck. This article lays out an end-to-end method: start from your parcel profile, design the carrier mix, select carriers with a scorecard, negotiate tiered rates and contract terms, allocate volume by rule, manage performance continuously, and tie it all into an annual cycle. Every step comes with a template you can copy.

Why this is worth reading: it turns the choices of which carriers to use, how to negotiate, and how to split volume from guesswork into a reusable operating mechanism your team can run and hand over. After the first full cycle, year two is fine-tuning.

Inside a modern fulfillment center, an operations manager studying carrier KPI dashboards on a large monitor with conveyor belts and packing stations behind, bright realistic scene
A carrier strategy ultimately lands on the numbers an operations manager watches every day

1. Why Carrier Strategy Is a Margin Decision

In a fulfillment center's cost structure, freight is almost always the largest variable cost after labor. For most 3PLs and independent fulfillment centers, carrier spend is the second-largest variable cost; in centers dominated by lightweight parcels it can even overtake labor and become the largest.[^1] That means every point saved on shipping lands almost directly in margin. Yet oddly, many operations managers are meticulous about labor costs and passive about carrier bills.

The multi-carrier strategy overview provides the wider framework for assigning primary, complementary, and backup roles. Use the carrier performance scorecard to decide whether those roles still fit observed results.

Without a strategy, this is how costs drift: rates come straight off the carrier's tariff, and you sign whatever discount they offer; volume is scattered across several carriers, but none of them has an incentive to discount for a small share; peak season brings surprise surcharges[^3], fuel surcharges ride the oil price[^4], and the year ends well over budget; when something goes wrong, who owns transit time and who pays for damage is settled by phone calls and luck. This is not an operations problem, it is a missing strategy.

With a strategy, it looks completely different: negotiation is grounded in data, and your parcel profile is the hand you play at the table; volume allocation follows rules, with which lane goes to whom and when to switch written down in black and white; performance is measurable, with transit, damage, and billing accuracy tracked per carrier; and costs are predictable, so the annual budget is not a guess.

This article gives operations managers at 3PLs and independent fulfillment centers an end-to-end method: start by knowing your parcel profile, design the carrier mix, select carriers with a scorecard, negotiate rates and contracts, allocate volume by rule, then manage performance continuously, and finally tie it all into an annual cycle. Every step comes with a template you can copy directly.
2. Know Your Parcel Profile First

Everything starts with the profile. Carrier discounts are not negotiated into existence; they are earned by your volume structure. Before you walk into any negotiation, answer one question: what does your freight actually look like? If you cannot describe your own parcel profile, you have no leverage at the table and no basis for allocation rules.

The fields to measure:

  • Add carrier services without operational complexity
  • Destination regions: share of volume by state or 3-digit ZIP, which marks your core lanes
  • Weight bands: share of volume per weight band, which sets your room for tiered discounts by weight
  • Size classes: share of standard, large, and oversize parcels, which decides whether you need specialty carriers
  • Service commitments: the transit promise distribution you sell to customers (ground 2-3 days, 2-Day, overnight)
  • Volume rhythm: daily, weekly, and monthly volume, within-week variance, peak multiplier
  • Surcharge exposure: residential share and remote ZIP share, which directly set your negotiation room on fuel and residential surcharges

Here is a sample monthly parcel profile (figures are illustrative):

Dimension Distribution / value (example)
RegionsWest Coast 38% / Midwest 22% / South 25% / Northeast 15%
Weight bands0-1 lb 35% / 1-5 lb 40% / 5-10 lb 15% / over 10 lb 10%
Residential share62% (residential surcharge is the big one)
Service commitmentsGround 2-3 days 70% / 2-Day 20% / overnight 10%
Monthly volume42,000 parcels, November at 2.3x the normal level

The profile drives every decision that follows: a high West Coast share argues for a regional carrier covering that region; a high lightweight share means negotiating tiered discounts by weight band; a high residential share means writing residential surcharge relief into the contract[^5]; a high peak multiplier means locking in peak capacity and surcharge caps early. Profile first, strategy second, the order cannot be reversed.

3. Designing the Carrier Mix

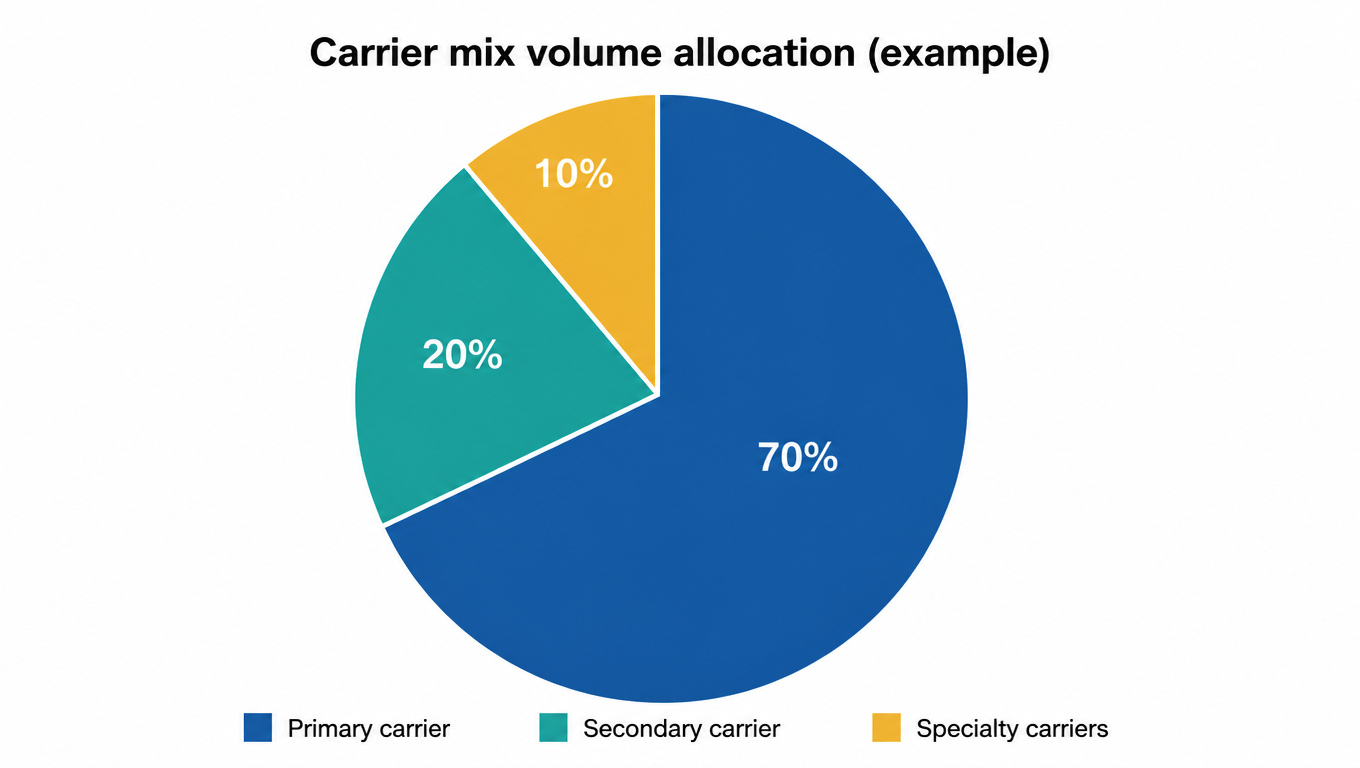
With the profile in hand, the next step is designing the carrier mix. The most robust structure has three tiers: the primary carrier takes the main volume and provides full-network coverage plus long-term contract discounts; the secondary carrier takes 10 to 20 percent of volume, serving as an emergency backup and as the leverage that keeps the primary honest in negotiations; specialty carriers cover lanes the primary network cannot serve well or cheaply, such as regional ground, oversize, and cross-border.

Why not bet everything on one carrier? There are three layers of risk: supply interruption, where one strike or one system outage can stop your center cold[^2]; lost bargaining power, where the bigger the share the harder it is to move, and the carrier knows you have no exit at renewal; and regional blind spots, where a national network's transit and price can lose to a regional carrier. The point of a mix is not to fragment volume; it is to let every carrier earn money where it is best while you always keep your options open.

A common starting split is 70/20/10: 70 percent to the primary carrier, 20 percent to the secondary, 10 percent to specialty. It is not a law, but it fits how most fulfillment centers actually run.

Pie chart: primary carrier 70%, secondary 20%, specialty 10%
70/20/10 is a sensible starting split for most fulfillment centers

There is one matching principle: start from the profile, map each lane's and each weight band's needs onto carrier capabilities, then decide which tier it belongs to. The profile is the cause, the mix is the effect. Decide where the freight should go and how to move it most cheaply first, then decide who does it, not the other way around, letting a carrier's tariff decide your operation.

4. Carrier Selection and Scorecard

Before a new carrier goes live, run it through due diligence. The checklist covers at least six items: network coverage, whether the actual delivery capability and transit map for your target regions are real; transit SLA, the committed transit per service class and historical attainment data; tracking capability, scan node density and API data quality; claims policy, the per-pound or per-piece liability cap and the claim window; financial stability, audited statements or proof of solvency; and system integration, whether the API, label specs, and reconciliation formats are compatible with your WMS.

Due diligence is not a gut check; it is scored. Here is a carrier scorecard template; adjust the weights to your business:

Criterion Weight Scoring guide (1-5)
Transit attainment25%5 = historical attainment ≥ 98%; 3 = 95%-97%; 1 = below 92%
Network coverage20%Coverage of target regions, transit map matching reality
Price competitiveness15%Gap vs primary carrier benchmark rates
Tracking and data15%Scan node count, API stability and latency
Claims and support15%Liability cap, claim window, response speed
System integration10%Integration cost, reconciliation automation

Set the pass line at a weighted total of 4.0 or higher, and add a few veto red lines: no end-to-end tracking, too-low liability caps, fabricated regional coverage, refusal to share historical transit data. Hitting any one of them is an immediate disqualification no matter the total score, because these are the mines that only detonate at scale.

Before ramping volume, run a pilot. Pick one representative lane, run a small batch for 4 to 6 weeks, and use real orders to verify three things: the gap between actual transit and SLA, the completeness of tracking data, and billing accuracy. Pilot data goes straight into the scorecard and beats any number a carrier's sales rep promises.

5. Negotiating Rates and Contracts

At the negotiating table, your leverage comes from four places. First, volume data: the profile from section 2 is the weapon, and a distribution precise down to weight band and lane leaves the carrier no room to blur. Second, multi-carrier competition: with a qualified alternative sitting in your scorecard, you are not afraid to walk away. Third, contract term: a three-year commitment usually buys a deeper discount. Fourth, peak volume commitment: trading predictable peak volume for year-round discounts is a deal both sides can accept.

The rate card is what you negotiate over. Here is a sample rate card. Note that surcharges are broken out separately: however low the base rate, surcharges can eat the entire discount:

Service class Base rate (example) Key surcharges (example)
Ground$4.85 first poundFuel surcharge 8.5%, residential surcharge $3.85
2-Day$9.20 first poundFuel surcharge 8.5%
Overnight$18.50 first poundFuel surcharge 8.5%
Regional carrier (West Coast)$3.40 first poundResidential surcharge $2.10

Negotiate discounts as a tiered structure. By volume: 70% off below 30,000 parcels a month, 66% at 30,000 to 60,000, 63% above 60,000, so incremental volume has a clear price reward. By weight band: negotiate the lightweight band hardest, because that is where margin is thinnest and the room to negotiate is largest. Negotiate surcharges separately: fuel, residential, remote, and oversize, each needs a defined rate and a cap.

Contract clause checklist, check line by line:

  • Rate change clauses: fuel adjustment trigger and cap
  • Minimum volume commitment (MQC): committed volume, breach penalties, how it ties to discounts[^6]
  • Peak surcharge caps: lock November-December peak rates in advance[^3]
  • KPI breach credits: compensation when transit or damage targets are missed
  • Term and exit: early termination window, data export obligations

One final negotiation discipline: structure first, price second. Unit price only means something once the structural items, discount tiers, surcharges, and clauses, are nailed down. In reverse order, you will sign a pile of bad clauses for one pretty first-pound rate. And everything in writing: a verbal promise that is not in the contract does not exist.

6. Allocating Volume Across Carriers

Contract signed, how do you split volume? Allocation has to satisfy three goals at once: cost optimality, freight goes to the cheapest carrier that works; risk dispersion, every carrier failing leaves you a way out; and measurable KPIs, each carrier gets enough volume to make its performance evaluation meaningful.

Three routing modes, which can be combined: route by lane or region, West Coast freight to the regional carrier and nationwide freight to the primary; route by weight band, lightweight parcels to the carrier with the deepest discount and oversize to specialty; route by priority, the primary gets first pick and the secondary backstops. Here is a sample routing table:

Scenario Primary Fallback Switch condition
West Coast groundRegional carrierPrimary carrierRegional carrier transit misses SLA for two straight weeks
Nationwide ground, standard parcelsPrimary carrierSecondary carrierPrimary near capacity or abnormal rate increase
Oversize / oversizedSpecialty carrierPrimary carrierSpecialty carrier raises rates
November-December peakPrimary 60% + secondary 40%Specialty carrier fills the gapPrimary peak surcharge hits the cap

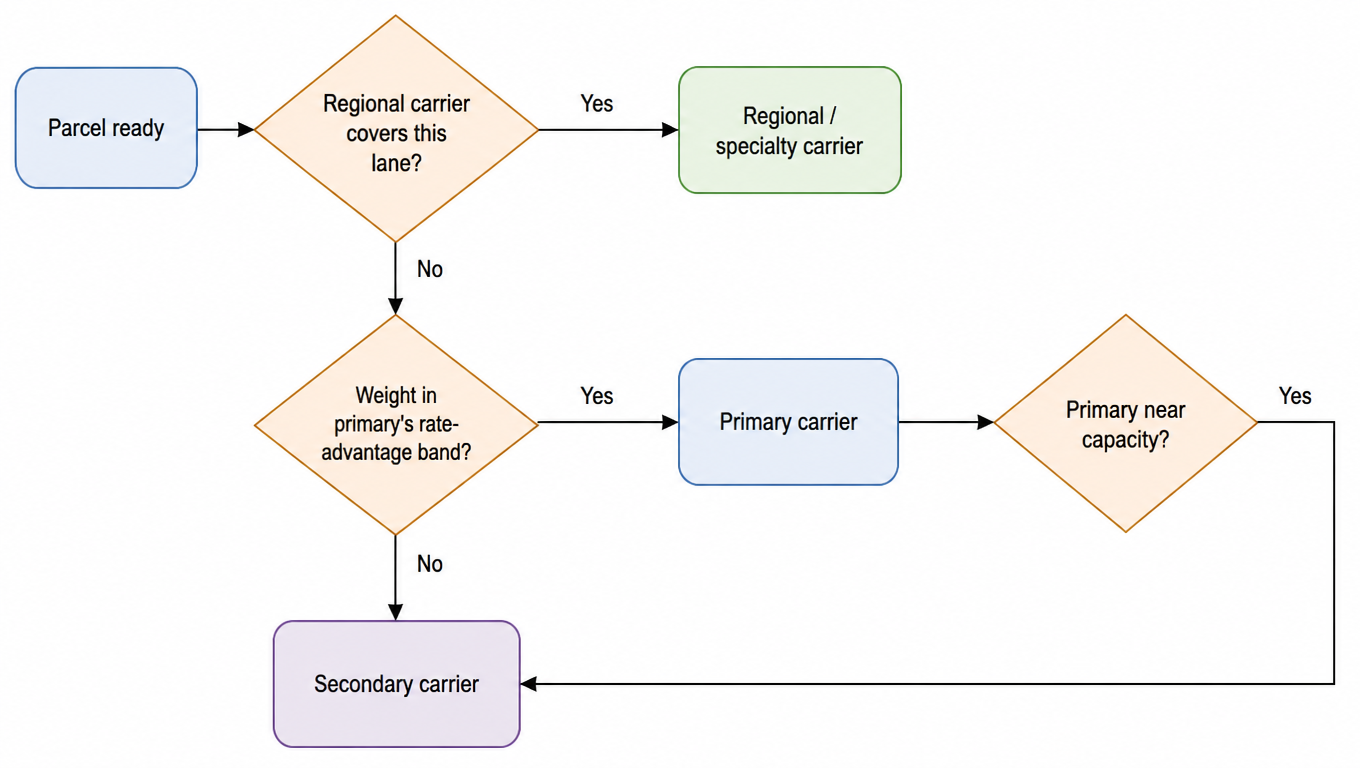
Routing rules must be hardened into system rules, written into the WMS routing configuration rather than kept in the warehouse manager's head. The decision logic looks roughly like this:

Routing decision flowchart: regional coverage, weight band, and capacity checks assign each parcel to a carrier
Routing decision: regional coverage, then weight band, then capacity, checked in sequence

Allocation is not decided once and frozen; it needs dynamic rebalancing. Every month, look at actual KPIs and billing data, cut volume from underperformers, add volume to strong performers, and keep correcting with volume as the lever. Two common traps: first, force-feeding volume to hit an MQC, stuffing freight to a slow carrier to keep a discount, saving on rates and losing customers; second, keeping allocation rules verbal and undocumented, so the rules disappear the day the manager leaves.

7. Managing Performance After Onboarding

Once volume is live, management begins. Build a measurable KPI system first, covering at least five metrics: transit attainment, target ≥ 98%; damage rate, target ≤ 0.1%; tracking scan updates, 100% at critical nodes; claim resolution time, target ≤ 10 business days; billing accuracy, target ≥ 99%. Every KPI needs a data source, a definition, and an owner, otherwise everyone talks past each other.

Run a monthly review meeting with a fixed agenda: data review, issue list, improvements, and next month's targets. The carrier's account manager must attend, minutes must be written, and every issue needs a close date. The point of the review is not blame; it is turning problems into action items both sides own.

Run a quarterly carrier scorecard, scoring actual quarterly performance on the same scorecard framework, with the score directly driving next quarter's volume changes. For example, above 4.5 adds 5 percent volume, below 3.5 cuts 10 percent. Allocation then has an open, transparent basis, and carriers know exactly where to improve.

Breach handling needs a clear escalation ladder: written warning, corrective period (usually 30 days), volume reduction, then termination. Every step follows the contract and leaves a paper trail. Termination is not a fight; it is executing the exit mechanism in the contract. As long as you signed the exit clause up front and hold a qualified backup, this step is a process, not a disaster.

8. The Annual Carrier Strategy Cycle

At this point the toolkit is complete: profile, mix, scorecard, negotiation, allocation, management. But strategy is not a one-time exercise; it should be an annual recurring mechanism. After the first full cycle, year two is fine-tuning.

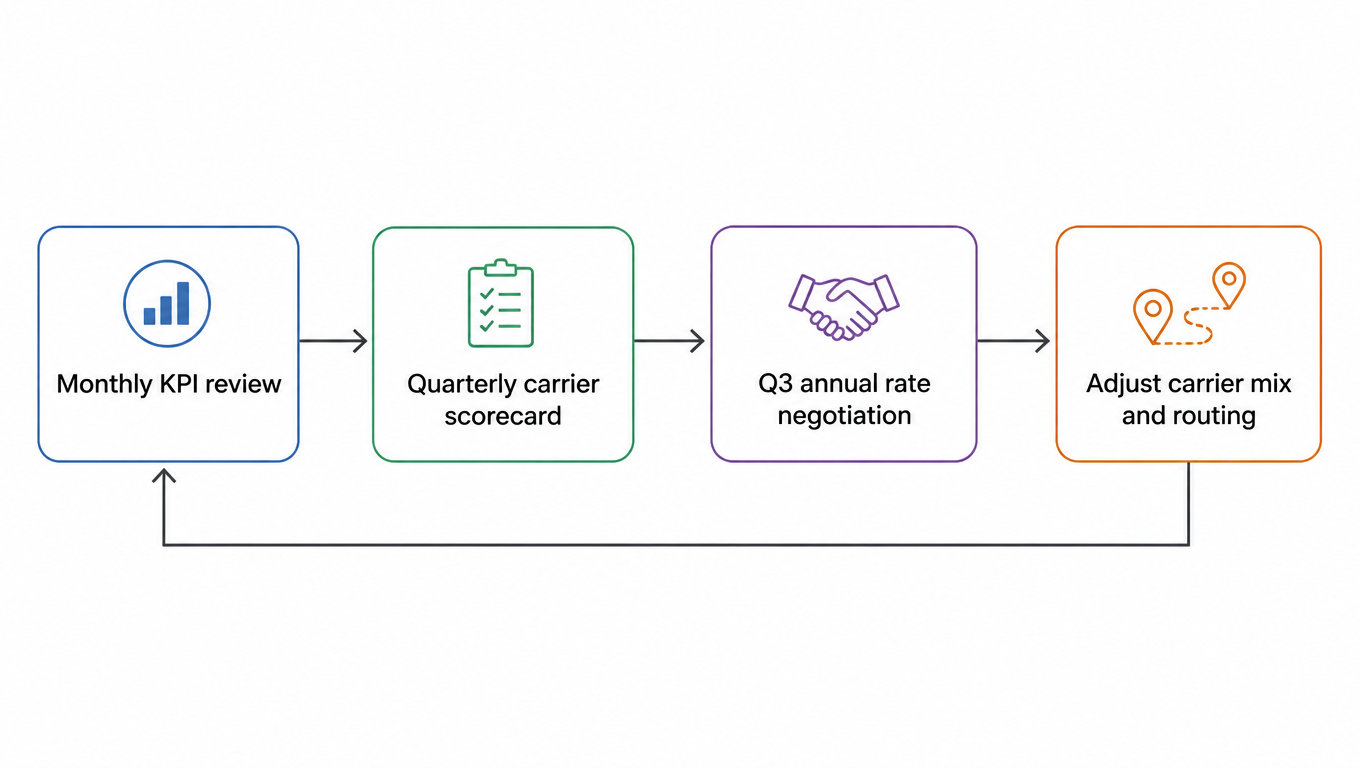
The rhythm looks like this: monthly KPI reviews, quarterly carrier scorecards with volume adjustments, and every year in Q3 (July to September), before peak season, launch the next year's rate negotiation, using this year's actuals and next year's expected volume to negotiate discounts and terms. The whole loop can be drawn as one diagram:

Annual cycle diagram: monthly KPI review, quarterly scorecard, Q3 rate negotiation, adjust mix and routing
A carrier strategy is a loop that rolls forward each year, not a one-time document

All strategy artifacts must be documented and archived in one place: rate cards, scorecards, routing tables, and the contract ledger, updated after every negotiation and adjustment. The point of the archive is that any new operations manager can open the folder and understand your carrier strategy without excavating their predecessor's brain.

Back to where we started: a carrier strategy is not a document; it is a mechanism that rolls forward year after year. Your volume structure changes, market rates change, and carrier capabilities change. The only constant is the method itself. Run it, and your freight spend turns from a cost you accept into an operating lever you can negotiate, allocate, measure, and predict.

FAQ

Know your parcel profile: destination regions, weight bands, size classes, service commitments, volume rhythm, and surcharge exposure. Carrier discounts are earned by your volume structure; without a profile you have no leverage at the table and no basis for allocation rules. Profile first, strategy second.
A common starting split is 70/20/10: 70 percent to the primary carrier for full-network coverage and contract discounts, 20 percent to a secondary that backstops and keeps the primary honest, and 10 percent to specialty carriers for regional ground, oversize, and cross-border. Then rebalance monthly against actual KPIs: cut underperformers, reward strong performers.
Every year in Q3, July to September, before peak season, launch the next year's negotiation using this year's actuals and next year's expected volume. The discipline is structure first, price second: nail down discount tiers, surcharge caps, MQC, peak surcharge caps, and the exit mechanism before unit price. Everything in writing.
Run due diligence on six items first: network coverage, transit SLA, tracking capability, claims policy, financial stability, and system integration. Score them on a weighted scorecard with a 4.0 pass line and veto red lines (no end-to-end tracking, too-low liability caps, fabricated coverage, refusal to share transit data). Then pilot on one representative lane for 4 to 6 weeks, validating transit, tracking, and billing with real orders, and feed the pilot data straight into the scorecard.

Ready to make multi-carrier operations configuration, not a project?

EasyShippingX provides Portal, Excel import, and API workflows for USPS and regional carriers, with services and rates governed by the enabled account list. Validate coverage and total charges by origin hub, destination, and parcel profile, then pilot tracking, billing, and a fallback path. Automatic routing or fallback requires separate configuration and validation.

Confirm coverage from the actual origin warehouse. For multiple warehouses, use order ZIPs to evaluate 3PL locations and compare eligible products and handoff costs for each origin.