Ecommerce Shipping Guide

How to Choose a 3PL Location Using Order ZIPs, Parcel Mix, and Delivery Promises

Ask ten ecommerce sellers how they picked their 3PL warehouse and you get two answers. The first is price: they compared monthly storage and pick fees and chose the cheapest spreadsheet. The second is geography by vibes: they picked Tennessee because someone said Nashville is central, or ruled out Ohio because Ohio sounded wrong. Neither answer survives contact with your actual shipping bill, because neither one starts from the only thing that determines what you pay and how fast you deliver: your orders.

Every order you ship already carries everything needed to choose a warehouse. It has a destination ZIP, a weight and a box size, a residential or commercial flag, and a date you promised the buyer. A warehouse, seen correctly, is not a state or a city. It is an origin ZIP, plus a rate sheet, plus a cutoff clock. This guide walks through the seven dimensions you compare candidates on: order ZIP distribution, parcel mix (weight and dimensions), address types, delivery promises, warehouse cutoff, carrier coverage, and actual quoted rates. State names never enter the calculation. To make the method concrete, we follow one seller through every step. Meet Atlas Supply, a US east-coast DTC brand selling home goods, doing just over 5,000 orders a month in a normal (non-peak) month. Atlas ships from a single third-party warehouse today, promises delivery windows from 1 to 5 business days at checkout depending on destination, and has begun to suspect its warehouse location is quietly inflating both its freight spend and its delivery times.

Small business owner studies a U.S. map marked with order locations beside parcels ready to ship.
State names are for postcards. Origin ZIPs, rate sheets, and cutoffs decide.

The Data You Need Before You Look at a Single Warehouse

Before Atlas (or you) looks at a single warehouse listing, it assembles six files. Each one is exportable from the store platform, the order management system, or the current 3PL in under an hour:

Use the multi-warehouse strategy to compare candidate origins as part of one inventory plan. Then apply the carrier serviceability checks to verify the parcel and destination mix that each location can actually execute.

  • Twelve months of order records, one row per package, with destination ZIP and state.
  • Weight and dimensions per package, taken from the parcel actually shipped, not the product listing.
  • An address-type flag: residential or commercial per order.
  • Carrier and service level used per order, plus promised versus actual delivery dates.
  • The current warehouse's cutoff time and its actual pickup schedule.
  • Contracted carrier rate sheets: the zone ladders, fuel surcharge, residential and delivery-area surcharges, and dimensional weight (DIM) rules your negotiator signed.

Point 6 is the one sellers skip, and it is the reason “just use the USPS zone chart” understates your real cost. What you pay is not the retail zone table; it is your contract's zone ladder re-run against your zone weights, with surcharges stacked on top. If you do not have your rate sheets in hand, stop and ask the 3PL or your parcel audit provider for them before doing any location math. Atlas has its sheets: two national ground contracts plus a lightweight USPS program, all with negotiated zone pricing.

The point of assembling the files before touring warehouses is discipline. Warehouse tours are seductive: loading docks look modern, account managers promise integrations. If the data does not drive the shortlist, the tour drives the decision, and the tour is where bad location choices get made.

ZIP Codes, Zones, and Your True Shipping Cost (A Quick Primer)

A zone is the distance band between a destination ZIP and the shipper's origin ZIP. The USPS publishes a zone chart numbered 1 through 8 [^4]; UPS and FedEx ground zones use the same logic with slightly different banding. Zone 1 is essentially local, zone 8 is the far side of the country, and the number in between mostly tracks distance, which is why zone math must always be anchored to a specific origin ZIP.

The zone number is what moves your per-pound cost. The bill visibly diverges somewhere around zones 4 to 5 and climbs steeply into 7 and 8. Two packages shipped from the same warehouse to two destinations can differ by dollars per package purely because of zone, with weight identical.

Two traps follow. First, zone is relative to the warehouse, so the same state can sit in very different zones depending on where you ship from. Michigan's Upper Peninsula and Detroit are both MI in your export, but from an eastern origin they can sit several zones apart. Second, aggregating by state hides exactly this: a state column is nearly useless for location math, and a ZIP-level view is the only honest one. This is why Atlas's first file is destination ZIPs, not destination states.

ZIPs that sit on a carrier's delivery-area surcharge (DAS) list complicate the math further: the same ZIP produces one answer for zone and another for DAS. Our guide to shipping zones versus carrier coverage versus delivery area surcharges unpacks why one ZIP produces three different answers; here the primer stays on the zone logic. To see the mechanism, Atlas runs a handful of its own orders through a zone chart for its current origin ZIP, a New Jersey 07001-class facility: New York, NY lands in zone 2, Chicago, IL in zone 5, Los Angeles, CA in zone 8. Same origin, same week, three very different zone bills. The exercise takes five minutes, and it is the first honest picture Atlas has ever had of why its shipping costs vary.

Step 1. Weight Your Orders by ZIP and Zone

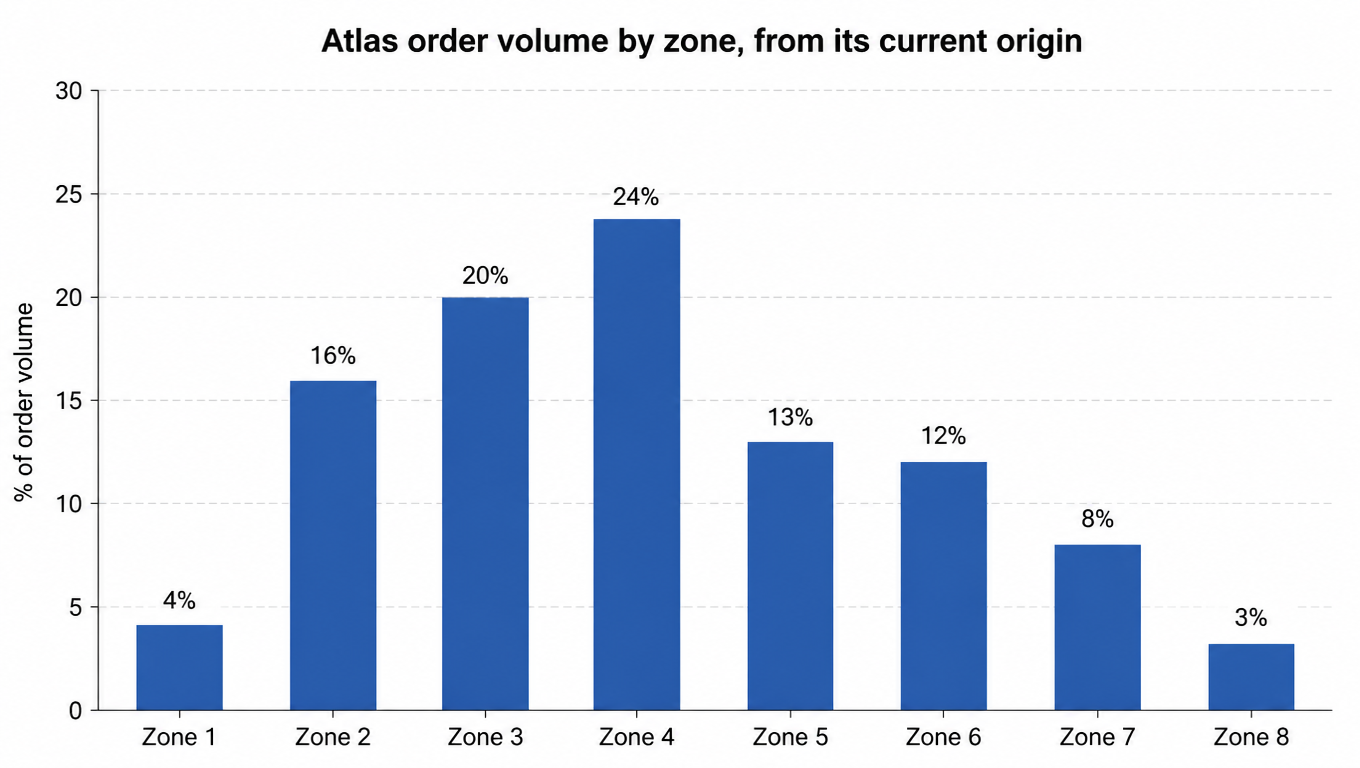
The primer gives you the vocabulary. Step 1 turns the 12 months of orders into a number. Atlas groups its 5,000 monthly orders by destination ZIP, maps each ZIP to its zone from the current origin using the zone chart its carriers publish for that origin, and counts volume per zone. The result is a zone-weight distribution: the share of order volume sitting in each zone, not the share of ZIPs. Volume-weighting matters because order volume concentrates: as a working assumption, roughly 80% of a typical seller's orders come from a small slice of ZIPs, and a warehouse placed near your volume core beats a warehouse placed near your ZIP-count core every time. One ZIP with 300 orders weighs far more than thirty ZIPs with 10 each.

Bar chart: Atlas order volume by zone from its current origin, share of order volume in zones 1 through 8
This distribution is the raw material for the location decision

The distribution is the raw material. From it Atlas computes a single summary number, the weighted average zone: multiply each zone by its volume share and sum. For Atlas the math runs (0.04 × 1) + (0.16 × 2) + (0.20 × 3) + (0.24 × 4) + (0.13 × 5) + (0.12 × 6) + (0.08 × 7) + (0.03 × 8), which lands at 4.1. That 4.1 is the baseline: from its current east-coast origin, the average Atlas package travels the distance of zone 4.1. Every candidate location gets scored against this baseline, because the same 5,000 orders produce a different distribution and a different weighted average from every origin. Note that 64% of Atlas volume sits in zones 1 to 4 from the current origin, and 36% sits in zones 5 to 8. Keep that 64% figure in mind; it becomes the crux of the decision later.

Step 2. Map Parcel Mix and Address Types to the Carriers a Location Can Actually Run

Zones tell you how far orders travel. Parcel mix tells you which carriers can carry them at all, and that pool changes with the origin.

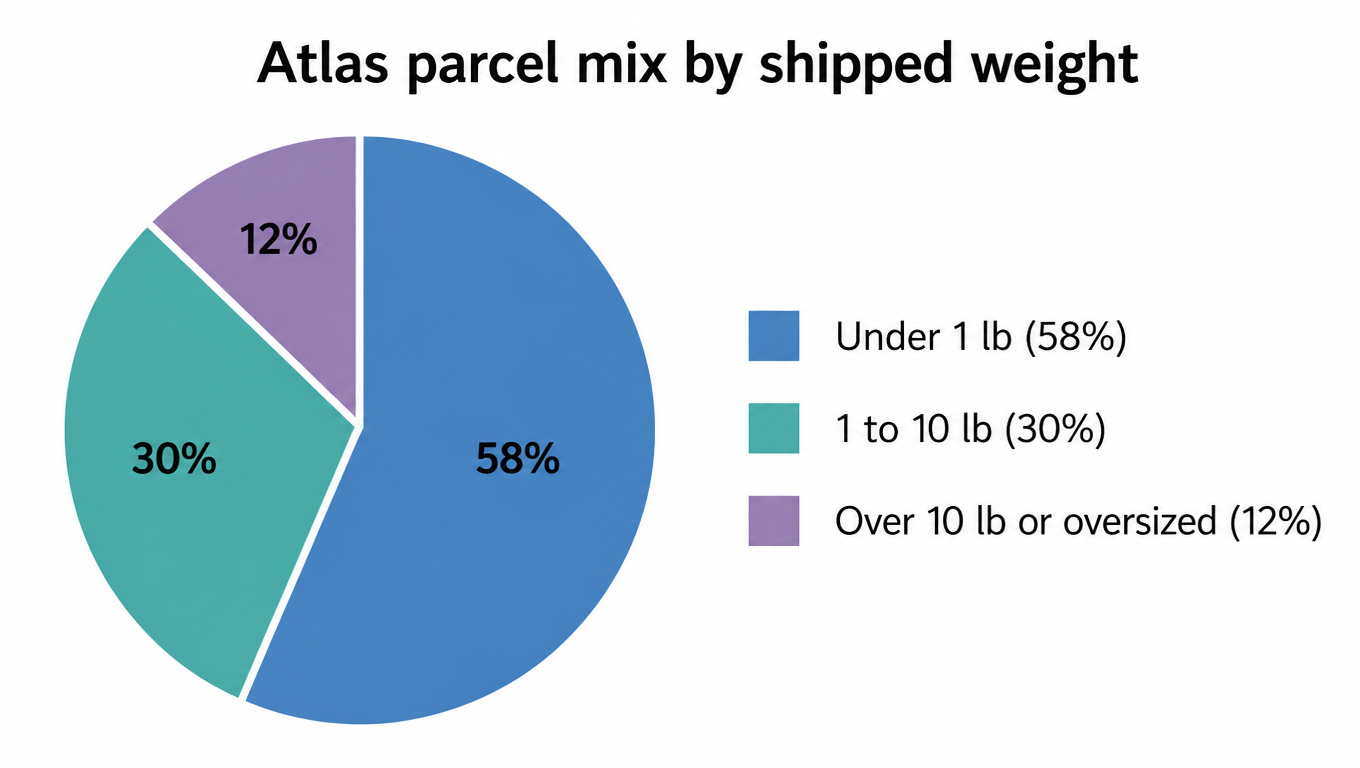
Atlas's parcel mix, by shipped weight, splits into three tiers: 58% of packages weigh under 1 lb and ride USPS First-Class zone pricing; 30% weigh 1 to 10 lb and ride the UPS and FedEx ground zone ladders; the remaining 12% are heavy or oversized, where dimensional weight (the greater of actual weight and length × width × height divided by the carrier's DIM divisor, 139 at both national ground carriers as of this writing) [^3] and per-package surcharges dominate the bill no matter which zone they land in.

Three differently sized parcels beside a tape measure and postal scale on a packing bench.
Your parcel mix decides which carriers a location can run
Pie chart: Atlas parcel mix by shipped weight, under 1 lb 58%, 1 to 10 lb 30%, over 10 lb or oversized 12%
Three tiers, each with its own carrier pricing logic

Address type is the second filter. Atlas's book is 62% residential, and that number matters because the two national ground carriers charge a residential surcharge on essentially every residential package (about $6 per package on the 2026 rate cards, revised each January; FedEx ground $6.45 [^1], UPS charges per its accessorial document [^2]), while the USPS lightweight program does not. A 62% residential book means nearly two-thirds of Atlas's ground volume carries that surcharge no matter which warehouse it ships from; what changes with the origin is how much volume you can route around it. Sellers with residential-heavy books lean on USPS and USPS-affiliated last-mile services precisely to dodge residential surcharges, and a candidate warehouse that cannot run those services well forfeits that option.

Carrier coverage is the third filter and the one that makes location tangible. Regional carriers and SurePost-style services do not serve every ZIP in the country from every warehouse. From a candidate origin, some ZIPs are reachable cheaply and some are not, and ZIPs in rural or resort areas may sit on a carrier's delivery-area surcharge (DAS) list, which adds dollars per package on top of zone [^5]. Coverage gaps force fallback to more expensive national ground, silently. So part of every warehouse tour is a mechanical question: run your top 200 destination ZIPs against the carriers this facility actually operates, and count how many of your packages would ride the cheap network versus the expensive fallback. When a regional carrier actually saves money is a coverage question, not a rate-card question; our guide on when regional carriers save money walks the ZIP-level test. Atlas runs this ZIP-coverage test for every candidate; it has already learned that the same parcel mix generates a different usable carrier pool from different origins.

Step 3. Work Backward from the Delivery Promise and the Warehouse Cutoff

The delivery promise is the constraint that turns zone math into a location requirement. A checkout promise is not a transit time; it is a compound: can the order catch today's cutoff (which sets the ship day), plus how many transit days the zone demands. Atlas's checkout says “arrives in 3 business days” for most of the country. Decompose it: an order placed before the warehouse cutoff ships that same day, and a same-day shipment into zones 1 to 4 typically transits in 1 to 2 business days on ground. That gets the package to the buyer inside the 3-day window. An order that misses the cutoff ships the next business day, which silently converts the promise into a 4-day reality for the same zone. The cutoff is not an operations footnote; it is half of the promise.

This is where time zones enter. A cutoff is local to the warehouse. Atlas's current east-coast warehouse cuts off at 2 pm ET, so an Atlas buyer in California ordering at 3 pm PT (6 pm ET) has already missed same-day dispatch and gains a full day. A western warehouse with the same local cutoff gives west-coast evening buyers a much longer same-day window in absolute terms, because 3 pm PT is 6 pm ET. The same checkout promise is therefore easier or harder to keep depending on where the clock and the warehouse sit relative to your buyers' ordering habits. If your order curve spikes in the evening, an early ET cutoff quietly erodes your promise every single day.

Transit is the part of the promise the location actually optimizes. The 3PL cannot fix your outbound SLA, your packing speed, or your cutoff discipline; what the warehouse location moves is the transit portion, and transit is a function of zone. Rough ground-transit guidance for planning: zones 1 to 2 transit in about 1 business day, zones 3 to 4 in about 2, zones 5 to 6 in about 3, and zones 7 to 8 in 4 to 5. Exact numbers come from your carriers' published transit for each origin, but the shape is stable. Work backward from promise to zone and you get a requirement table:

Checkout promiseMax zone with same-day dispatchMax zone with next-day dispatch
2 business daysZones 1 to 2Zone 1
3 business daysZones 1 to 4Zones 1 to 2
4 business daysZones 1 to 6Zones 1 to 4
5 business daysAll zonesZones 1 to 6

Atlas's goal, set before any candidate tour: 3-day delivery for at least 90% of order volume, on ground rates, without quietly upgrading to premium air. Read the table: a 3-day promise with same-day dispatch needs zones 1 to 4, and Atlas's current origin reaches only 64% of volume in zones 1 to 4. The requirement is therefore a warehouse that pulls at least 90% of Atlas's order cloud inside zone 4, with a cutoff late enough that the same-day dispatch assumption holds for the majority of orders. That is the spec every candidate now gets scored against.

Step 4. Score Candidate Warehouses Against Your Order Cloud

Atlas shortlists four candidates plus its current facility, and every one enters as a real origin ZIP, never as a state name: current east-coast site (07001-class), Columbus, OH 43215, Nashville, TN 37210, Dallas, TX 75247, and Reno, NV 89502. For each, Atlas asks its prospective 3PLs for the same quote package: the contract zone ladder per service, fuel and residential surcharges, DAS ZIP lists, oversized and DIM handling rules, the local cutoff time, the carriers the facility actually runs, and the ZIP footprint each carrier covers from that origin.

Each candidate then gets scored on four accounts, all computed from Atlas's own order cloud and that warehouse's actual quote, not from published retail zones:

  1. Promise coverage: the share of Atlas's 5,000 monthly orders that fall in zones the warehouse can serve within 3 days on ground, given its cutoff.
  2. Weighted landed cost per order: contract zone rate × zone weight share, plus fuel, plus the 62% residential surcharge exposure, plus DAS and oversized shares, summed across the whole cloud.
  3. Cutoff feasibility: whether the local cutoff actually supports same-day dispatch for Atlas's order-time curve.
  4. Carrier coverage gaps: how many of Atlas's top 200 destination ZIPs would fall back to expensive national ground from this origin.

Atlas assembles the results. The scoring table is the whole argument, and it is why state names never appear in the final decision:

Origin (warehouse)Weighted avg zone% of volume within 3-day promiseEst. landed cost / order
Current east-coast site4.164%$7.47
Columbus, OH 432153.392%$6.92
Nashville, TN 372103.688%$7.02
Dallas, TX 752474.462%$7.55
Reno, NV 895025.652%$8.31
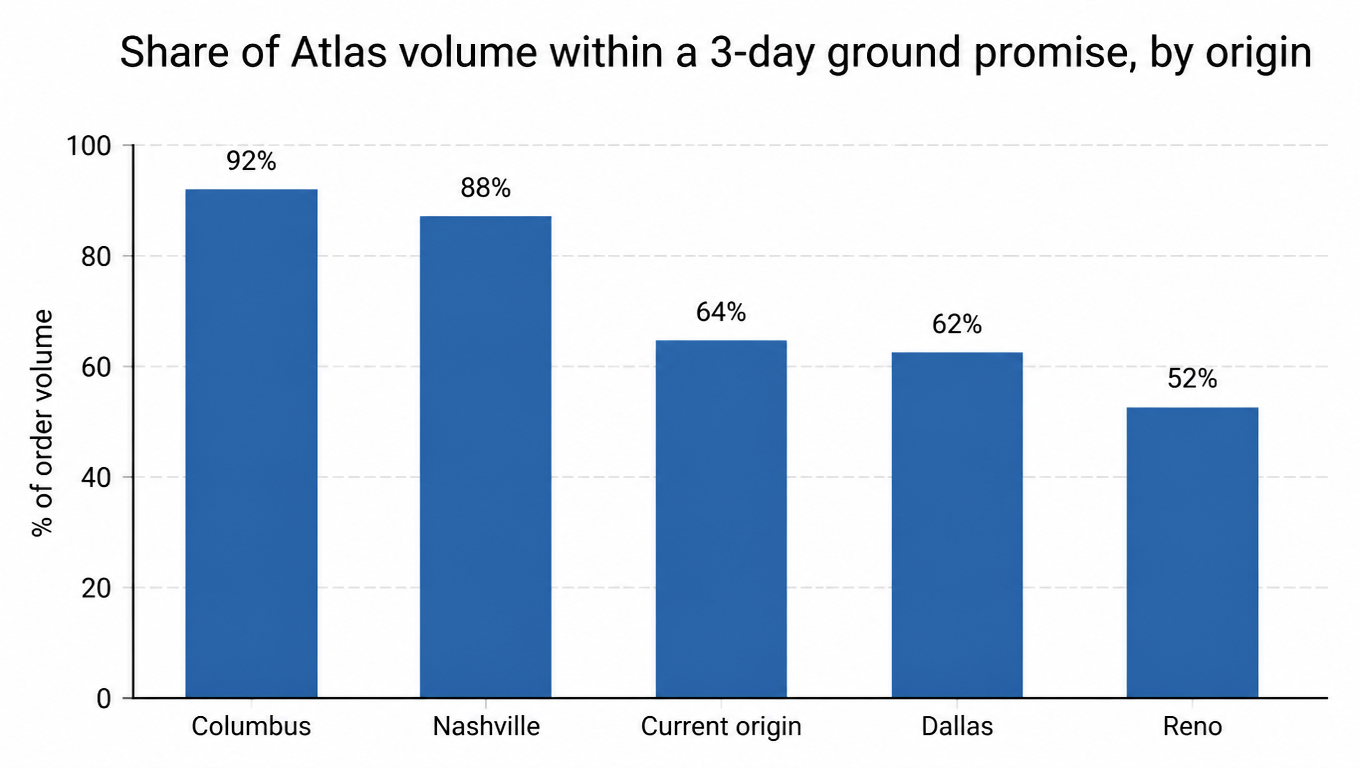
Bar chart: share of Atlas volume within a 3-day ground promise by origin, Columbus 92%, Nashville 88%, current origin 64%, Dallas 62%, Reno 52%
Columbus is the only candidate that clears the 90% coverage spec

Two facts stand out. Columbus is the only candidate that clears Atlas's 90% promise-coverage spec (92%), and it also carries the lowest landed cost per order ($6.92, about 7% below the current origin). Nashville is close on cost and second on coverage but misses the coverage spec. Dallas and Reno fail both columns because Atlas's volume core sits east of the Mississippi; Reno is a textbook example of a warehouse chosen for the wrong reason, looking good on a map for California while doing nothing for a book that is not Californian. On the spreadsheet, the recommendation is unambiguous: Columbus. The move decision, however, is a separate question, and it has thresholds.

Turning the Math into a Decision: Thresholds That Say “Move”

Relocation is expensive. Recalculation is free. Atlas therefore refuses to let a spreadsheet alone trigger a move, and it writes down four quantified triggers before doing anything. If none fires, the answer is “keep and tune”, not “move”.

  • Trigger 1, promise failure. Actual promise fulfillment, orders that arrived by the date shown at checkout, drops below 95%, or the share of volume the current origin can serve within the promise on ground rates falls below 90%. In this example, Atlas's current origin serves 64% in zones 1 to 4. Trigger 1 fires hard.
  • Trigger 2, cost gap. The best candidate's weighted landed cost runs more than 10 to 15% below the current origin. Atlas's Columbus gap is about 7%, so trigger 2 does not fire on its own. The rule exists to stop sellers from relocating for a rounding error.
  • Trigger 3, zone drift. The order cloud migrates. Atlas re-measures its weighted average zone from the current origin every quarter, and treats a widening of a full zone, 4.1 to 5.1 or worse, as a hard trigger, because it means the customer base itself has moved. A half-zone drift, 4.1 to 4.6, is a watch signal that forces a re-run at the next quarterly review, not an immediate move.
  • Trigger 4, payback. The move pays for itself fast enough to justify the risk. Atlas estimates the full cost of switching at about $30,000: relocation and re-verification labor, a few weeks of dual running while the new site ramps, new packaging and label setups, and integration work. Against monthly freight savings of about $2,750 ($0.55 per order × 5,000 orders), the payback is roughly 11 months. Atlas's rule is that a relocation must clear within 12 months of freight savings alone. Trigger 4 fires.

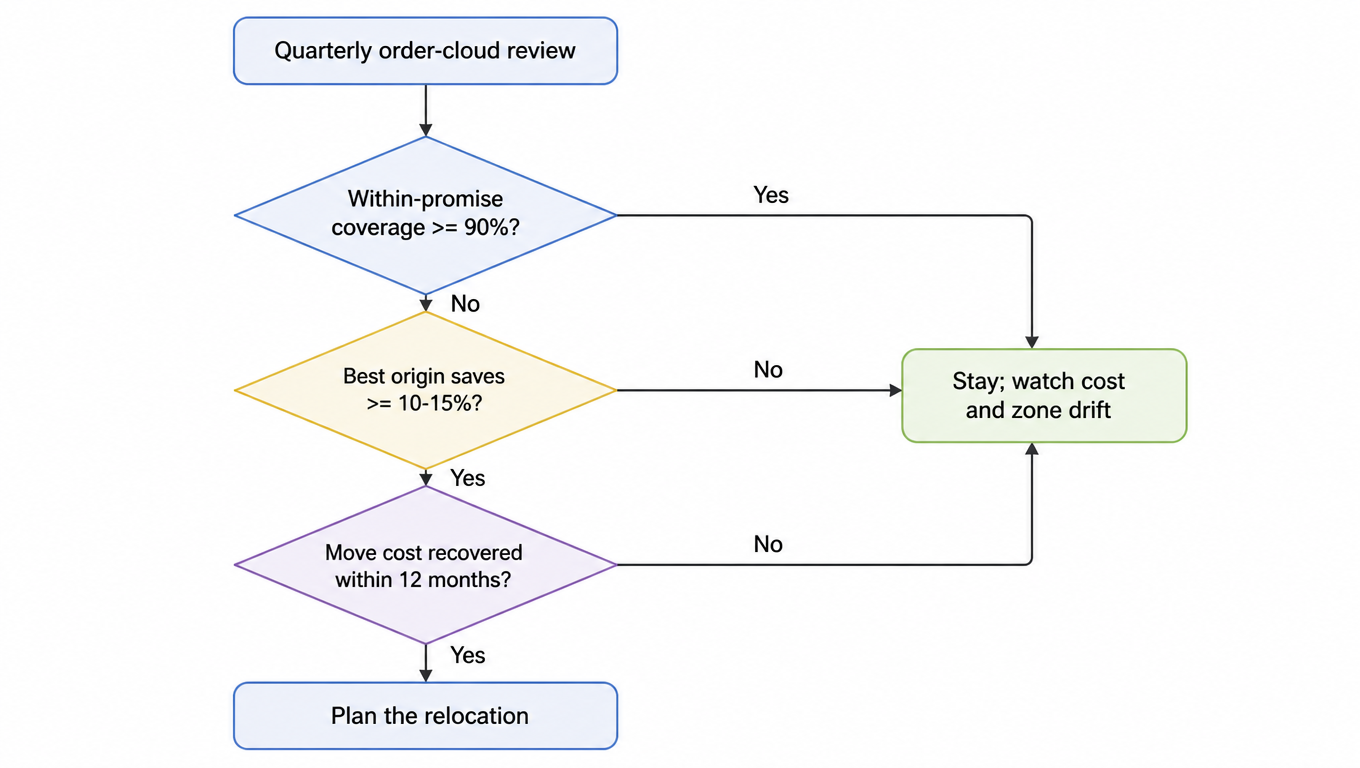
Two of the four triggers fire for Atlas: the coverage failure (64% versus the 90% bar) and an 11-month payback. That combination, and only that combination, is what justifies the move. The flow chart below is the decision discipline: one failing number is a reason to renegotiate rates or change the carrier mix; a failing coverage number plus a fast payback is a reason to move.

Decision flowchart: quarterly order-cloud review → within-promise coverage ≥ 90%? If no → best origin saves ≥ 10-15%? If yes → move cost recovered within 12 months? If yes → plan the relocation; other paths stay and watch cost and zone drift
One failing number: renegotiate. Failing coverage plus a fast payback: move.

Single versus multi-warehouse follows the same discipline. One location wins while it covers at least roughly 80% of order volume within the promise at acceptable cost. Atlas's Columbus candidate covers 92%, so Atlas stays single-warehouse; adding a second node would split parcel volume and weaken contract tiering, double the fixed 3PL minimums and storage, and duplicate inventory, all to fix a coverage problem that one central origin already solves. Two locations only pay off when promise coverage or cost stops moving with the first site, meaning the best single origin cannot reach the 80% bar, or a node pair cuts weighted landed cost enough to clear its own added fixed costs. A west-coast expansion becomes worth revisiting only if Atlas's order cloud migrates west far enough to drop the single-origin coverage back under the bar. A multi-node network is a different operating model, where each node negotiates its own contracts and runs its own cutoff, which is why you audit a multi-warehouse 3PL node by node and size when splitting inventory earns its cost before adding one; our guides on auditing a multi-warehouse 3PL and on multi-warehouse strategy walk both.

One rule is locked in too: when the math says move, treat the chosen origin like any new partner. Rate cards do not survive real orders, but test orders do. Before you sign, run the candidate through a controlled test-order set; our guide to piloting a 3PL before you sign turns the rate card into evidence.

Recalculate, Not Regret: Make ZIP Review a Habit

Atlas's verdict: move to Columbus, on an 11-month payback, and take the 64% coverage number up to 92%. The relocation is a big action, but it was triggered by a small habit: running the order cloud through the same steps on a schedule. The method in this guide is a recurring health check, not a one-time project, because order clouds, parcel mixes, carrier rate sheets, and 3PL coverage all drift.

The cadence Atlas commits to: re-run the order-cloud zone weights quarterly (a 20-minute export and spreadsheet job), re-quote candidate rates twice a year and whenever a carrier changes its January rate card, and re-test the relocation decision whenever any trigger trips. Every review outputs one of three verdicts: keep, tune (renegotiate the rate sheet, shift carrier mix, or fix the cutoff), or move (relocate, or add a second node when the math finally supports it).

None of this requires a warehouse tour, and that is the point. Tours decide the finalists; the data decides the winner. If you are evaluating a warehouse today, or quietly wondering whether your current one is right, start with the six files, run the four steps, and write down the four triggers before you look at a single loading dock. State names are for postcards. Origin ZIPs, parcel mix, cutoffs, and quoted rates are for decisions.

When you run this arithmetic on your own order data, put the candidates and your own accounts on one table: ZIP-based carrier serviceability and rate comparison, so every “is this rate right, and who should ship it” question runs on data. A channel-neutral shipping layer like EasyShippingX compares US domestic carrier options uniformly and executes through a portal, Excel, or API, which is exactly the tooling for getting rates, labels, tracking, and billing onto one table. For the arithmetic, use our shipping rate calculator; to map your order cloud into zones from any origin ZIP, use our USPS zone calculator; and our pricing page shows how the layer is delivered. It fits inside the broader operation rather than replacing it.

FAQ

Use the last 12 months, because order structure drifts with seasonality and growth, and 12 months captures both your normal and peak ZIP and weight shapes. The export does not need to be surgical: volume by destination ZIP and tiers by shipped weight are enough. If 12 months are unavailable, use the most recent complete quarter and re-run once you have a full year.
Run the math before you split. While one location covers at least roughly 80% of order volume within your promise at acceptable cost, single-warehouse wins: a second node splits volume, weakens contract tiering, and doubles fixed 3PL minimums and storage. A second warehouse pays only when the best single origin cannot reach the 80% coverage bar, or when a node pair cuts weighted landed cost enough to clear its own added fixed costs. The Atlas case in this guide is the pattern: volume core east, Columbus covers 92% alone, and the answer is to move, not to add.
Not by itself. A retail zone chart tells you distance bands, not cost: you pay your contract zone ladder re-run against your zone weights, with residential, fuel, DAS, and oversized charges stacked on top. Comparing candidates means running weighted landed cost per order on each warehouse's actual quote, not on published retail rates. The zone chart is the right tool for coverage and weighted-average-zone math; cost needs the quote.
Yes, and it is half of the promise alongside the zone. A checkout promise equals catching the cutoff (which sets the ship day) plus the transit the zone demands. Cutoffs are local: from an east-coast warehouse, a west-coast evening buyer loses a day almost every order; if the location's cutoff cannot support same-day dispatch for most of your order curve, the promise fails before you move anywhere. That is why “cutoff feasibility” belongs on the scorecard as its own column, not just zone coverage.
Re-run the order-cloud zone weights quarterly, re-quote candidate rates twice a year plus whenever a carrier changes its January rate card, and re-test the relocation decision whenever a trigger trips. Each review outputs one of three verdicts: keep, tune (renegotiate rates, shift the carrier mix, or fix the cutoff), or move. Recalculation is free and relocation is expensive; running the cadence keeps “should we move” permanently answerable by data.