System onboarding: the decision at this stage
System-onboarding path, step 6: Monitor execution and reconcile billing. Confirm applicability, evidence, and owners before continuing.
You already picked your WMS. What you are choosing now is the execution layer between it and the carriers: a shipping platform or a carrier API integrator, the software that turns a scanned order into paper on a box. This guide is a diagnostic for that decision. The main line is written for warehouse operations leads, the people who will feel the result on the floor. Engineering callout blocks carry the deeper technical detail for the integration developers who will have to live with the choice, and you can skip them without losing the argument.
The core argument is simple: label speed is not a printer problem and not really a WMS problem. It is a property of the whole chain between the scan and the paper, and most of that chain lives in the layer you are about to buy. That means you can predict which vendor will feel fast on your floor before you sign, not by watching a scripted demo, but by asking the right questions and running one short bench test of your own. Everything below is built to get you to that point.

System-onboarding path, step 6: Monitor execution and reconcile billing. Confirm applicability, evidence, and owners before continuing.
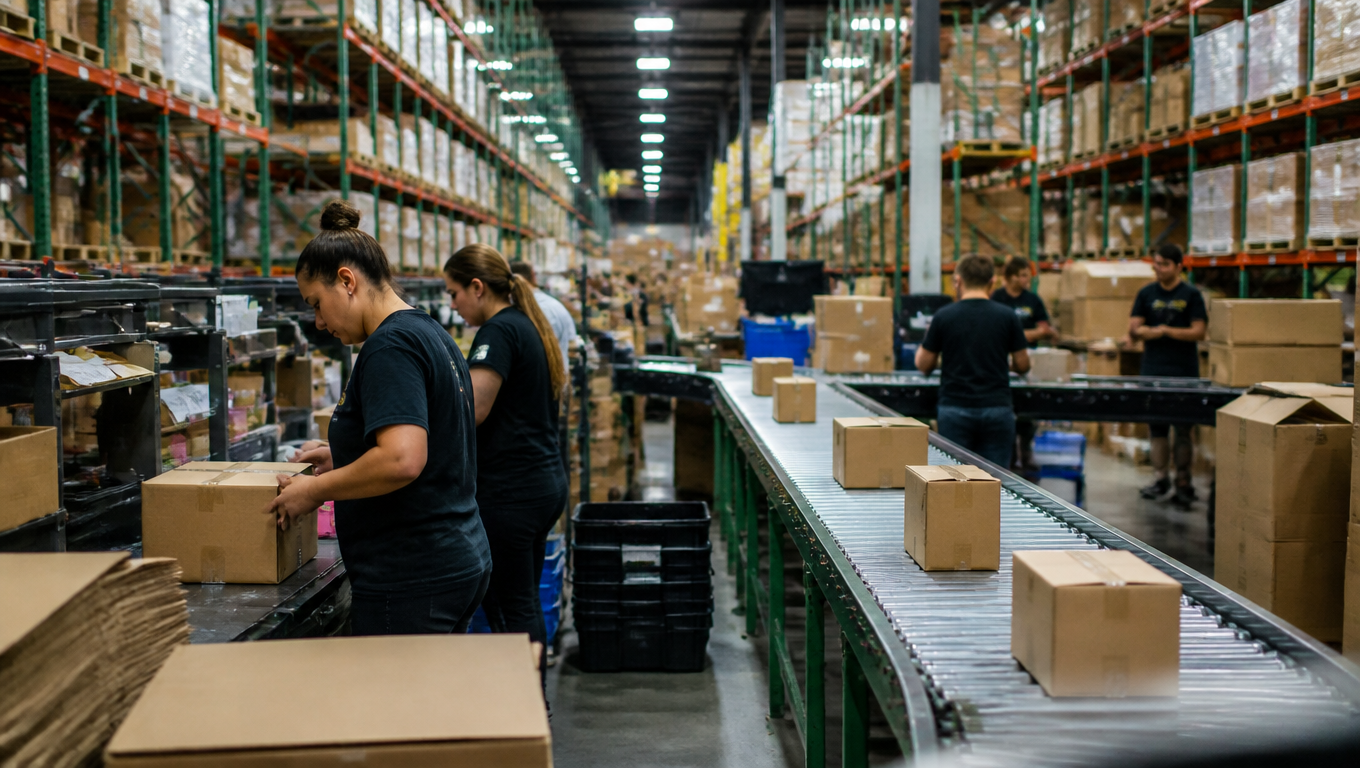
Walk onto any packing floor and the pack station is where every upstream system's speed becomes visible. A scanner beeps, then the packer stands there waiting for the printer. Each second of that wait is a second of labor with no throughput attached. At a modest pace of 80 packages an hour per station, three seconds of dead time per label is the difference between roughly 73 and 80 packages an hour: a 9 percent swing that compounds across every station and every shift. Labor is typically the largest single cost category in a fulfillment operation, per Opensend's analysis of warehouse labor costs (link in the sources section below), so that compounding wait is a payroll question, not a printer question. Small delays feel trivial one label at a time and turn into headcount questions at the end of the quarter.
The pack station is also where latency complaints always land, even when the cause is upstream. The packer does not see the carrier API or the WMS lookup; they see the printer. So the floor blames the label printer, the IT helpdesk blames the network, and nobody measures the actual chain until someone runs out of patience. If you are evaluating a shipping platform or carrier integrator, this is the trap to avoid: you will be tempted to judge the vendor by the printer in front of you, when the printer is usually the innocent bystander.
The honest framing is that label time is the sum of every hop in the chain, from the moment the scanner registers a package to the moment paper exits the printer. Some of those hops belong to the WMS you already committed to, some belong to the execution layer you are choosing now, and a couple belong to hardware you may not have thought about since you bought it. You cannot fix the chain you cannot see, so the first step in any evaluation is mapping it, which is what the next section does.
Here is the mental model that makes every other section make sense: a label is not generated when the vendor's system says "label generated." A label exists when the printer has paper in hand. Everything between those two moments is the chain, and the fastest printer in the world cannot fix a slow chain, any more than a fast cashier fixes a long queue. The chain, in order, looks like this: the packer scans a package, the WMS looks up the order and its address data, the execution layer composes a label request, the carrier API validates and returns the label payload, the response travels back, the label is rendered for the printer, the print job sits in the printer queue, and paper finally comes out. Eight hops, one of them yours to watch, most of them upstream of the printer.
"Label generated" means different things in different vendor vocabularies, and the difference matters at contract time. For a carrier API integrator, it often means the carrier accepted the request and returned a payload, which is a real milestone but still leaves rendering, spooling, and physical printing to happen. For a shipping platform with its own print layer, it may mean the job reached the print queue, which is closer to paper but not paper yet. When a vendor quotes you a per-label time, ask exactly which milestone they measured and whether the printer was included. If the number stops at the API response, add a realistic rendering and printing budget before you compare it with what your packers experience today.
Engineering callout: where time actually hides. A reasonable starting budget for a single-piece scan-to-paper chain is roughly: scan and order lookup under 300 ms combined, request composition and transport 100 to 200 ms, one synchronous carrier round trip 500 to 1500 ms on a healthy day and several seconds during degradation (per the monitoring review of October 2025's multi-carrier outages), parse and render 100 to 300 ms, and spool plus physical printing 500 to 1000 ms. The carrier round trip dominates because it is the only hop that crosses a network boundary twice and depends on a third party's API health. The other classic hiding places are less obvious: serialization and re-serialization of the request payload at each hop, TLS and connection setup when the execution layer opens a new connection per label instead of reusing a pool, and printer spooler behavior where the driver rasterizes on the workstation rather than sending native printer commands. This is also why a single happy-path demo number is meaningless: demo traffic never hits a degraded carrier, a cold connection pool, or a spooler under load. Ask for demand percentiles and distributions from the vendor, or measure them yourself, which the bench test in this article shows you how to do.
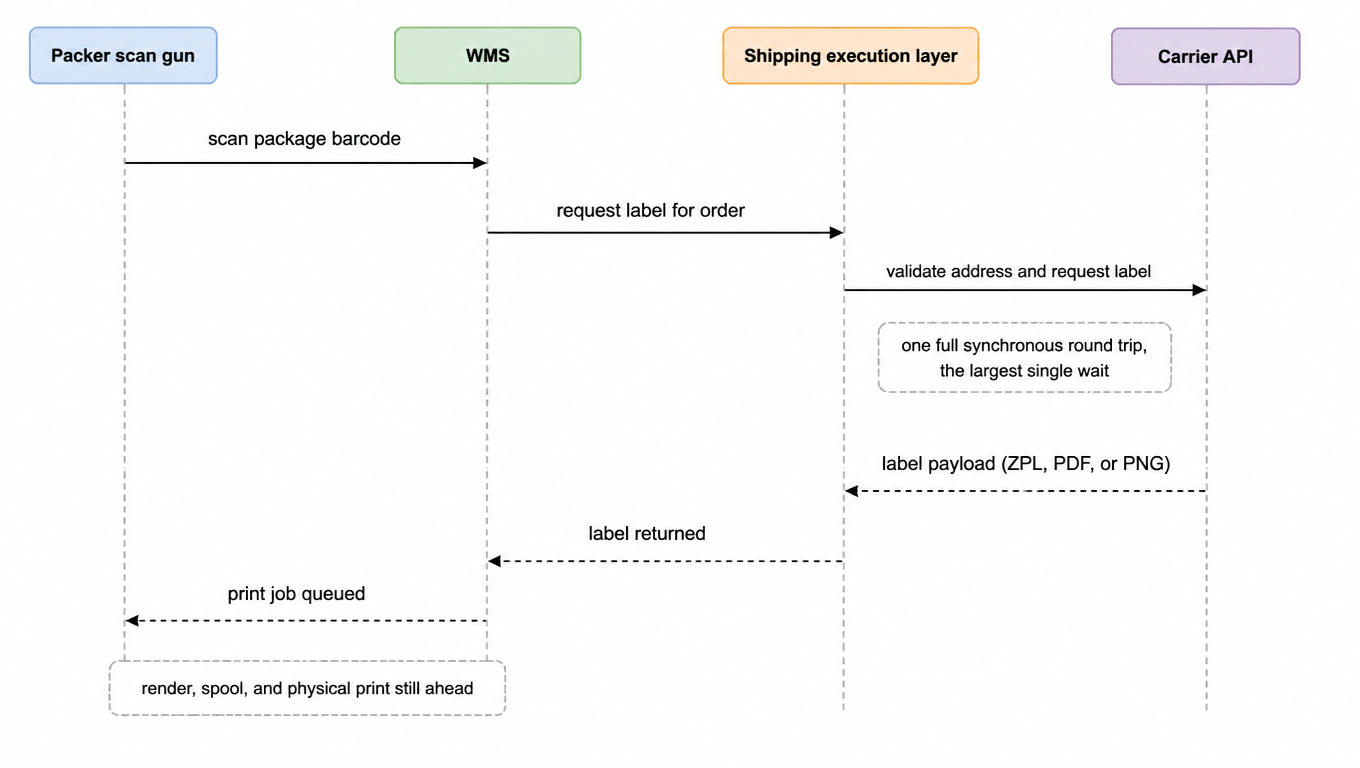
The practical takeaway for the selection process: do not let the vendor frame the conversation as "how fast is your printer" or "how fast is our API." Reframe it as "how long does the whole chain take on our floor," and hold every candidate to that question. The trigger model determines how that total lands on your packers, which is the subject of the next section.
The same chain produces very different floor experiences depending on how labels are triggered, so the first thing to pin down in any evaluation is the trigger model your operation actually runs. There are three families, and most warehouses run one of them as the daily reality with another as a backup for waves or peak.
Per-piece trigger is the scan-to-label model: the packer scans one package and waits for one label before the box moves on. Latency lands directly in the packer's cycle time, so a 2 second chain adds 2 seconds to every package, with no amortization. This is the model where percentiles matter most, because a p95 of 6 seconds means one package in twenty costs the station six seconds of standing around.
Batch trigger pulls a whole wave of orders at once and prints the labels as a run. Latency is amortized across the batch, so the average per-label cost is much lower, but the failure profile is different: one bad record or one carrier rejection can stall the entire run while the station waits for the exception to be cleared. A vendor can look excellent on batch throughput and still ruin a shift when the run stops dead at order 147, an example position, your own wave decides the real one.
Scheduled batch generates labels on a timer for the next shift or the next carrier pickup. Nobody waits interactively, so "fast" means something else entirely: the relevant questions are whether the run finishes before the cutoff, whether it is complete when the dock door opens, and what happens when a scheduled run fails silently and the labels were never produced. Evaluators who only compare happy-path speed will miss all of it.
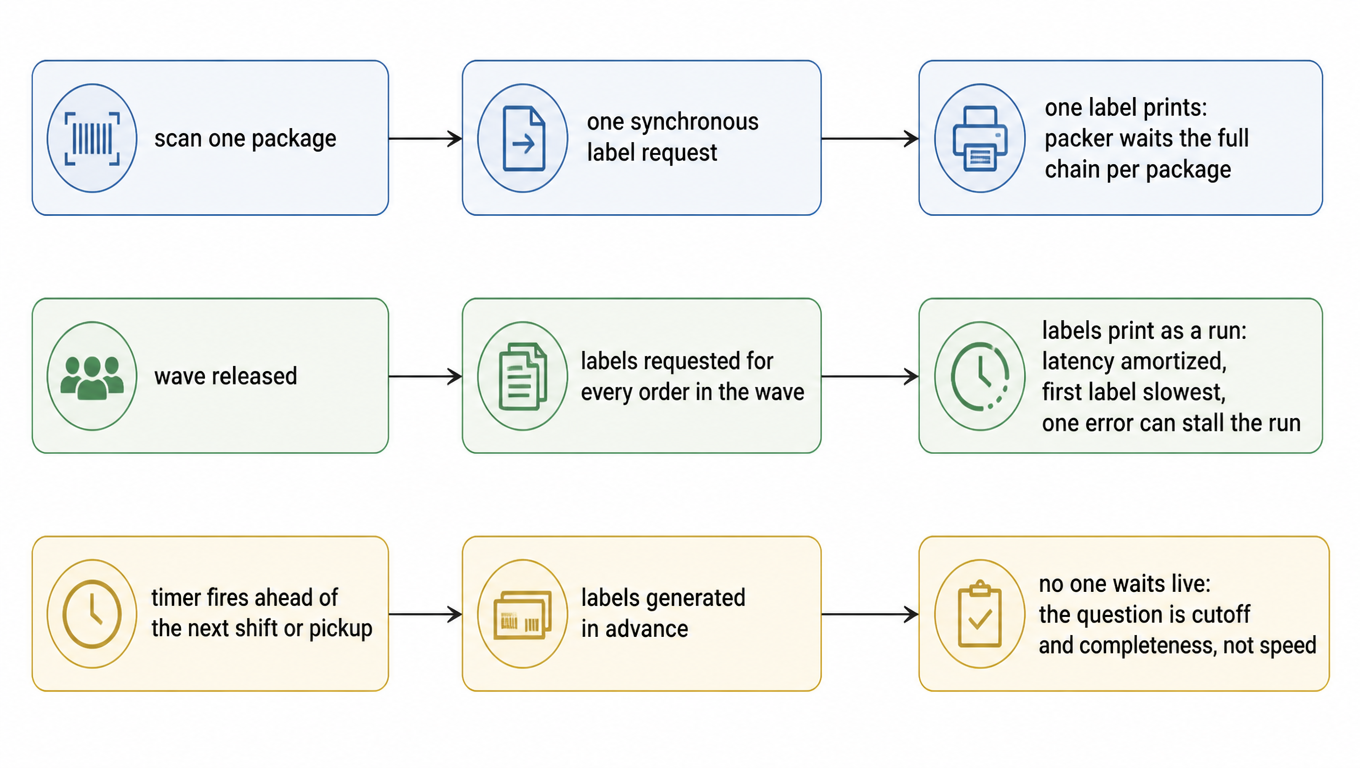
The selection questionnaire therefore has to ask which trigger models the product supports and how each one actually behaves under your order profile, not which one the demo happens to show. A vendor demo will almost always show the prettiest model, usually per-piece on a clean connection. Ask for the other two, and ask what the interactive path does when a batch path is running at the same time, because in a real warehouse both happen simultaneously and they compete for the same API credentials and the same connection pool.
Engineering callout: synchronous, async, and the trap of "it's async." Architecturally, per-piece is a synchronous blocking call from the pack station's perspective: the station asks and waits. Batch and scheduled paths are usually queue-based, where the request is accepted and processed asynchronously, which is why their aggregate latency looks better. The trap is an async promise that still blocks on the first label of a run: if the worker that drains the queue must itself call the carrier synchronously and the queue is cold, the first label pays the full round trip plus queueing delay, and a burst of scanned pieces can pile up behind a single worker. When a vendor says "it's asynchronous," ask what actually drains the queue, how many workers, what the retry policy is, and whether label generation is deduplicated and cached for identical requests. Those answers predict peak-day behavior far better than the architecture slide.
Once you can see the chain and name your trigger model, the next step is knowing where time hides in practice. Four sources account for the overwhelming majority of slow pack stations we see, and each one can be exposed in a vendor demo or a trial account with a specific test. None of the four is the printer.
The execution layer makes one full request-response call to the carrier for every label, and the slowest carrier or service in your mix sets the pace for everything. This is normal architecture, but it becomes a problem when nothing absorbs it. The demo test: ask to see network timing on a real label request, then ask what the p95 looks like when your heaviest carrier, the one with the most address validation rules, is in the mix. A candidate that cannot show you per-request timing cannot show you where the time goes.
Rates, address validation, package dimension checks, and carrier account lookups get re-fetched or re-computed for every identical label even when nothing changed since the last one. Two identical packages scanned back to back should not cost two full validation round trips. The demo test: generate the same label twice in a row and compare the time. If the second one is not meaningfully faster, the system is not caching what it could, and on a station that prints repeat SKUs all day, that waste is constant.
The label format is rendered in the browser or on a client workstation, the barcode is rasterized as a heavy image instead of being drawn by the printer, or the driver re-encodes the whole job on the client instead of sending native printer language. This moves CPU work onto the machine at the pack station and makes print time a function of workstation hardware, which is exactly what you do not want to be true at 4 PM on a peak day. The demo test: ask where rendering happens, ask whether the printer receives ZPL or EPL commands or an image, and watch the workstation CPU during a print run. Server-side rendering to native printer language keeps print speed independent of the client machine.
The printer sleeps and has to wake, the spooler holds jobs behind a stuck document, or the driver negotiates at low speed. These look like printer problems and often are, but they are also the cheapest things to fix, and a vendor with a good print layer will have opinions about them: supported printer models, native driver behavior, and queue monitoring. The demo test: watch the spooler during a run, check the printer's sleep settings, and print a pure ZPL job from a terminal to separate printer behavior from the execution layer's behavior. If the pure job is instant and the vendor path is slow, the time is in the software, not the printer.
Vendors rarely surface these four sources, because each one only appears under realistic conditions: a real carrier mix, repeated identical orders, client hardware that is not brand new, and printers that have been on for eight hours. A scripted demo removes all four conditions at once. That is not malice, it is just what demos are. It is also why the last two sections of this article matter more than any feature comparison.
This section is the core deliverable of the article. Take it to the two finalists and score the answers side by side. The questions are deliberately answerable in a trial account, and a candidate who cannot answer them with data is answering them with hope.
| Question | Good answer | Red flag |
|---|---|---|
| What is your per-piece p95 under load? | A number with a measurement window and method | A single happy-path average or a feature slide |
| Which milestone does that number include? | Carrier response plus render plus print | "Label generated," printer excluded |
| Which trigger models are supported? | Per-piece, batch, scheduled, with coexistence behavior documented | Only the one the demo showed |
| What happens during a carrier outage? | Documented timeout, retry, and queue behavior | "We have never had an outage" |
| Can a label be regenerated without re-billing? | Yes, with de-duplication and idempotency | Unsure, or re-billing happens on retry |
| Where does rendering happen? | Server side, native printer language | In the browser or on the workstation |
| Is the latency number in the SOW? | Yes, with a remedy | No, and no willingness to discuss |
The questionnaire tells you what to ask; the bench test tells you what is true. Thirty minutes with a trial account, a real printer, and a prepared script will teach you more than an afternoon of vendor meetings, provided you set the pass-fail line before you start, because a result you define after the fact is always negotiable.
Set up the test to mirror your floor: the same carrier and service mix as production, including your slowest carrier and your heaviest parcel type; realistic batch sizes; and a scan cadence close to what your packers actually sustain. Then run the three trigger models as they would run on your floor, and deliberately include one broken label or a forced carrier timeout so you watch the failure behavior instead of reading about it. Record per-hop timings where you can, the total per trigger, and the p95 across the run, plus every failure and retry you observe.
A representative single-piece run from a bench test like this might produce medians that look like the table below. The exact numbers will differ on your floor; the shape will not, with the carrier round trip dominating and print trailing behind. The table figures are illustrative examples, not promises.
| Hop | Median (ms) | p95 (ms) |
|---|---|---|
| Scan trigger | 90 | 160 |
| WMS order lookup | 240 | 520 |
| Compose and send request | 130 | 300 |
| Carrier API round trip | 900 | 2100 |
| Parse and render label | 190 | 420 |
| Print queue and paper | 760 | 1500 |
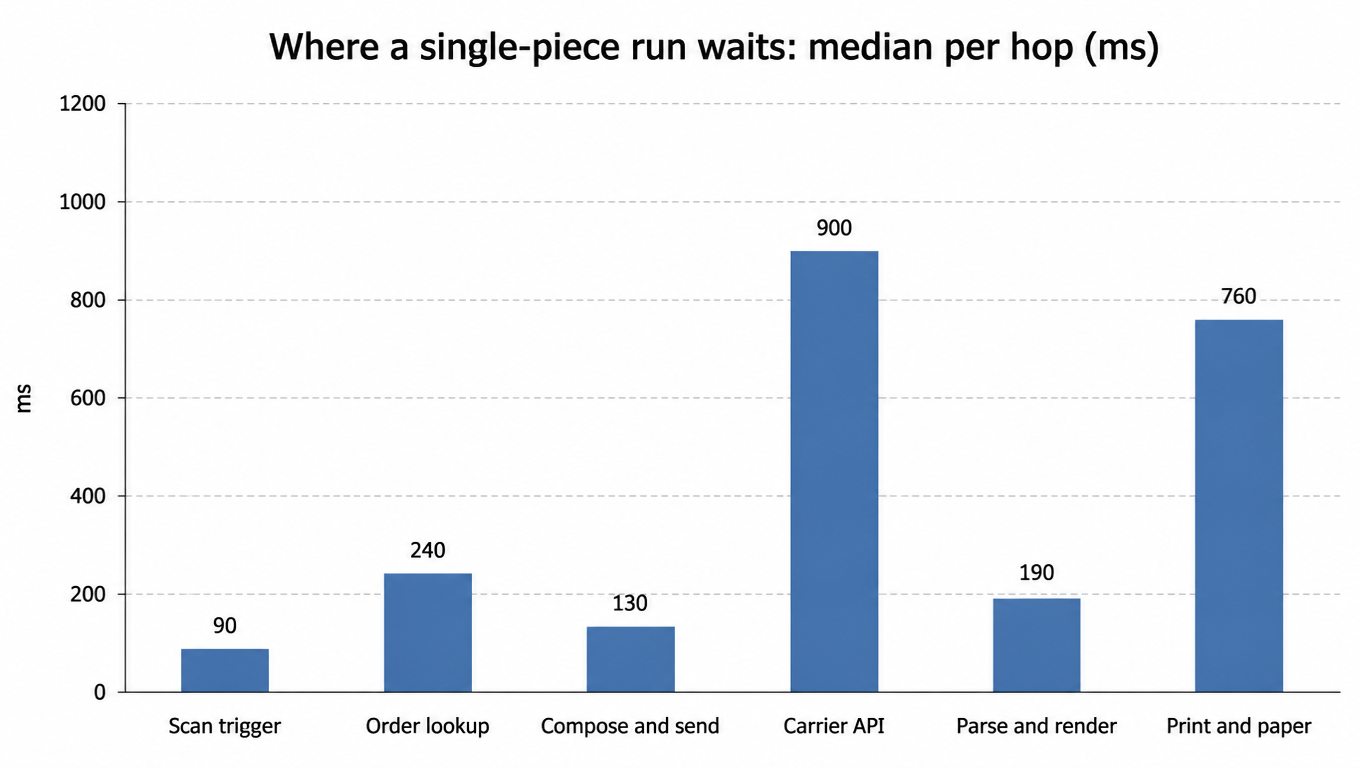
Engineering callout: capturing per-hop timings yourself. In a trial account, ask for API response headers with server timing, enable the execution layer's own timing logs if exposed, and use a proxy or network inspector to time each call from the workstation. On the WMS side, check whether it logs the time between scan and its outbound label request, which isolates the execution layer's contribution. The three numbers worth demanding from a trial are the carrier round trip, the render time, and the time from carrier response to spooler, because those three belong to the vendor and are the ones you will hold them to later.
Compare the two finalists' record sheets side by side, with your pass-fail line drawn in advance. Watch the tail, watch the failure behavior, and watch whether the vendor's numbers from the questionnaire survive contact with your test.
Turn per-hop diagnosis into a post-launch operating record. State whether timing starts/ends at scan, queue, request, label file, or physical printing. Do not merge means/percentiles across different trigger models. Measure successful, failed, retried, and manually recovered work separately so successful-request timing does not conceal blocked operations.
| Monitor | Definition and evidence | Response owner |
|---|---|---|
| Workstation performance | Per-hop scan-to-paper timing, trigger mode, workstation, and load, including failures. | Warehouse operations and print/system owner |
| Duplicates and recovery | Retries, unknown outcomes, duplicate labels/charges, and query/manual-review conclusions. | Engineering and operations |
| Events and source confirmation | Deduplication, ordering, missing-event recovery, and final confirmation received by OMS/WMS. | Integration and source-system owners |
| Charges and client outcomes | Quotes, label costs, late adjustments, received credits, client billing, and promises. | Finance and client owner |
| Scope changes | Revalidation after new clients, facilities, services, software versions, or load. | Owner of the affected stage |
Set thresholds from the facility’s trigger model, client promise, provider agreement, and measured baseline. Existing timing examples and the 30-minute protocol illustrate measurement, not any platform’s guarantee. Return recurring issues to failure-path acceptance to confirm recovery before pausing or adjusting.
Carry charge evidence into shipping reconciliation and quote-to-final-charge review. Return the overall conclusion to the integration requirements and acceptance entry and record the basis for maintaining, adjusting, pausing, or expanding scope.
Buy the execution layer whose latency behavior you verified under your trigger model, your carrier mix, and your peak load, not the one whose demo looked fast. The diagnostic fits in one paragraph: map the chain from scan to paper, name your trigger model, ask for latency percentiles that include the printer, and run your own 30-minute bench test with the pass-fail line drawn first. Take this article's questionnaire to the two finalists, run the bench test on both, and put the record sheets side by side. The vendor that survives that process will feel fast on your floor, which is the only speed that pays your payroll.
The questionnaire and the bench test answer "which execution layer"; the next step is piloting the finalists with your real orders. EasyShippingX is a channel-neutral shipping layer: it compares US domestic carrier options and executes through the Portal, Excel, or the API. See the EasyShippingX Features page for the public scope, and the EasyShippingX Shipping API page for endpoint capabilities and failure semantics. During an evaluation, use the API Readiness Checklist to review field mapping and exception handling; whether to start with the portal or the API first depends on whether you want to validate the interactive path or automate first; and before peak, run the finalists through the load-testing framework. For plan fit, review plans and pricing.
Note: the per-hop budgets and the bench test table are illustrative planning figures that demonstrate the diagnostic method; your real numbers must come from your own measurements or the vendor's percentile data.
No. Define scan-to-paper milestones, trigger mode, and load; measure failures/recovery separately and review events, charges, and client outcomes together.
Carry this stage’s evidence and open items forward. Keep unconfirmed capabilities pending rather than replacing verification with defaults or more volume.