Logistics Guide

Returns Shipping Strategy for DTC Brands and 3PLs

Every DTC founder knows the feeling: a customer orders, loves the brand, then hits "return," and a profitable order turns into a cost line. For brands that treat returns as a logistics chore, that cost line compounds. For brands and 3PLs that treat returns as a strategy, it becomes a retention engine, a data source, and a service business. This guide walks through both sides: what brands should optimize, what 3PLs can sell, and how the two together turn the most disliked part of e-commerce into a growth channel.

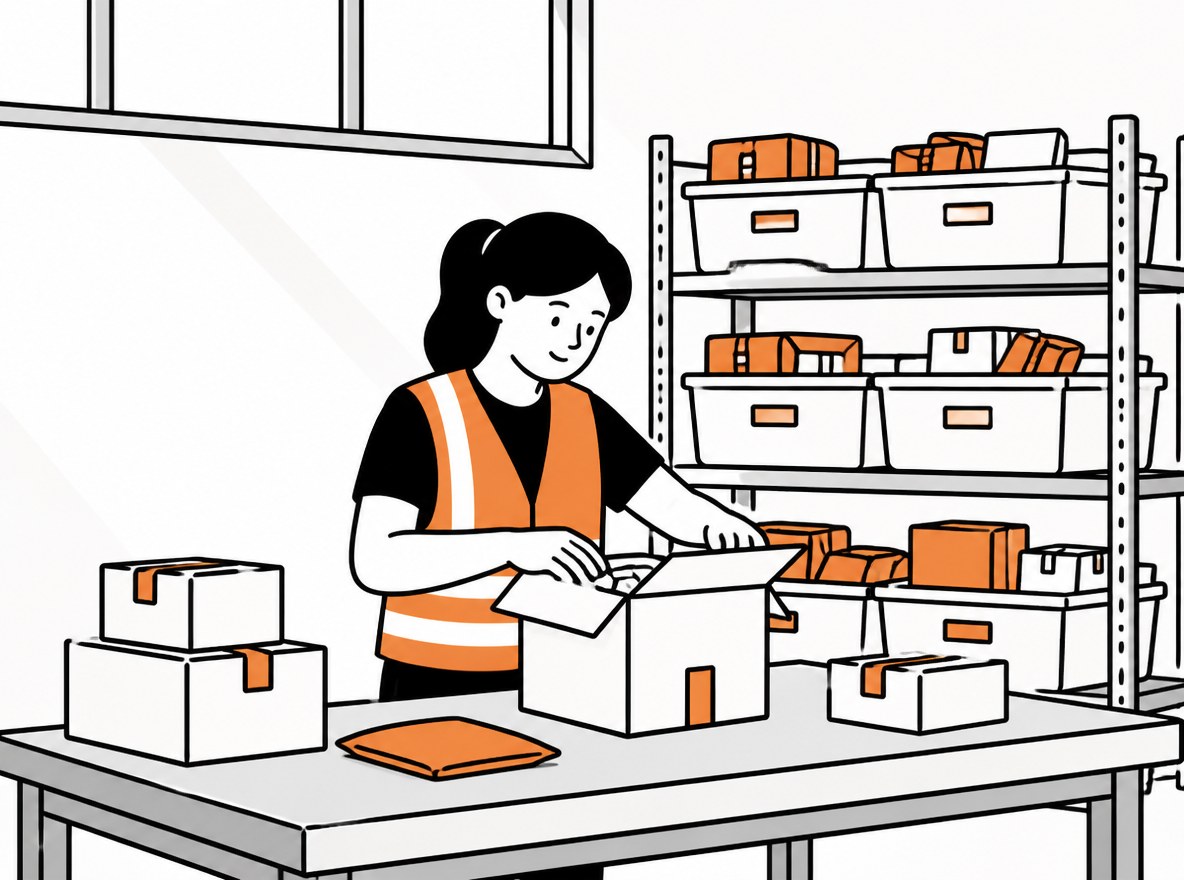
Worker opens returned parcels at a steel workbench beside labeled sorting shelves.
Returns are not a chore: they are the interface between brand retention and 3PL revenue

Why Returns Became a Strategy Problem, Not a Logistics Chore

E-commerce return rates run 20 to 30 percent across most categories, and apparel and footwear both climb into the 30 to 40 percent band. Consumer electronics hover around 15 percent, home and garden sit in the 10 to 15 percent range, and beauty products stay closer to 8 percent. In gift-heavy months, a brand can easily see a third of its holiday revenue come back through the door.

The cost asymmetry is brutal. Handling a returned item typically costs 2 to 3 times what it cost to ship it out. Forward shipping is batched, labeled, and volume-priced. A return arrives one box at a time, gets opened, inspected, re-tagged, restocked, and often sold at a discount. Every step is manual labor, and the item usually cannot sell at full price a second time.

What changed in the last few years is not the cost, it is the context. Returns used to be an after-sales chore handled by the cheapest intern and the most basic carrier contract. Today the return experience is one of the top reasons customers choose, trust, and repurchase from a brand. That is why a modern returns strategy runs three levers in parallel: cost, experience, and revenue. Optimize only one and you leak value from the other two.
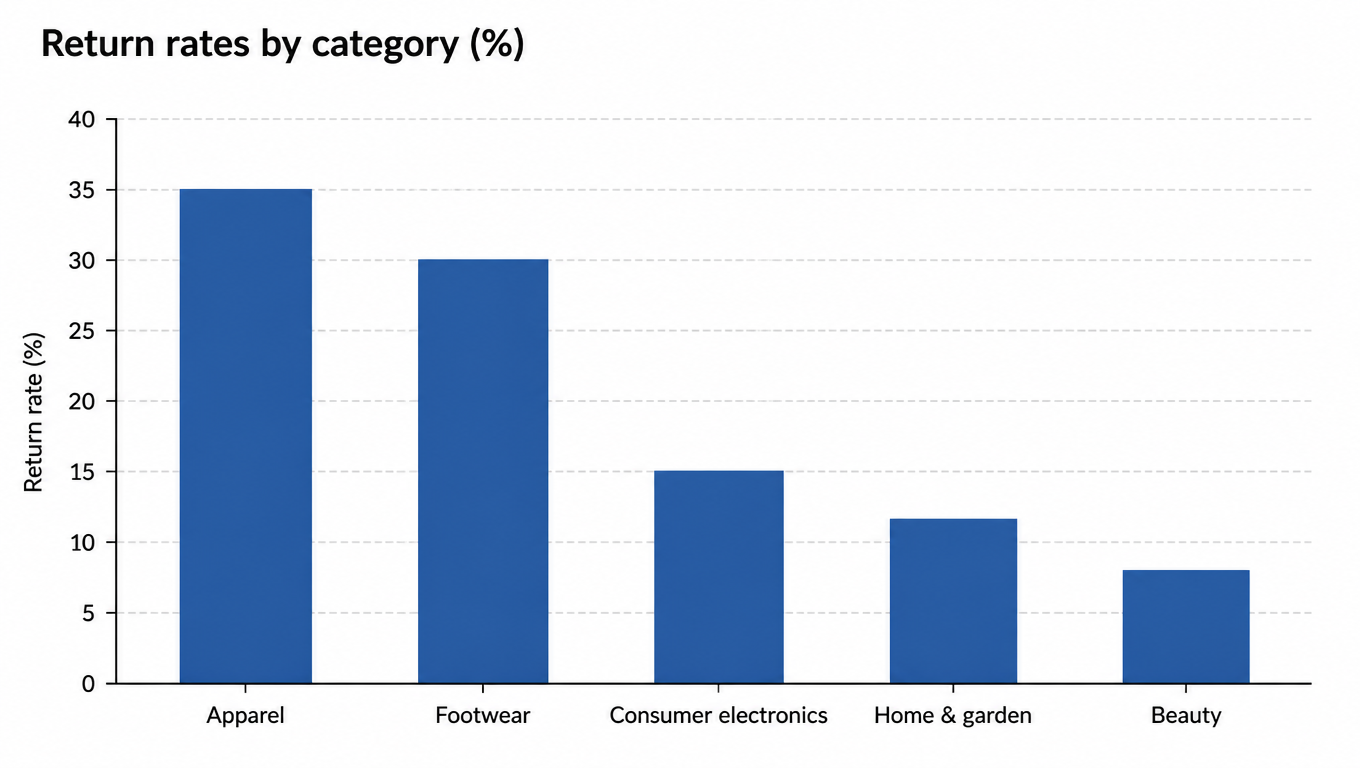
Bar chart of return rates by category: apparel 35%, footwear 30%, consumer electronics 15%, home and garden 12%, beauty 8%
Return rates by category

The Returns P&L: Cost, Experience, and Revenue

Start with the cost line, because it is the only one that shows up as a line item on the P&L. Return freight, receiving and inspection labor, restocking, refurbishment, and disposal each eat margin. A representative example: processing a returned $50 apparel item costs $8 to $12 end to end. Freight alone is often $4 to $5, receiving and inspection another $2 to $3, and restocking or refurbishment $1 to $2.

The experience line is where most brands lose money without noticing. A customer who hits a paywall to return, waits weeks for a refund, or has to print a label at 11pm will not complain to you, they will just not come back. Well over half of shoppers read the return policy before placing an order, and commonly cited studies put the share of customers who would repurchase after an easy return above 90 percent. Smooth returns compound into repeat purchases, higher customer lifetime value, and better ratings.

The revenue line is the newest and most underused. Exchange-first policies keep the original order value in house. Refund-to-store-credit keeps the money on your platform instead of a competitor's. Refurbished and open-box resale recovers value from items that would otherwise be written off. Each of these turns a return from a loss into a partial or full recovery.

The trap is treating returns as a pure cost center. Cost-only optimization pushes you toward hostile policies, slow refunds, and minimal inspection, which quietly destroys the experience and revenue lines. The operators who win run all three lines at once: cheap enough to process, easy enough to retain, and structured enough to recover value.

The Brand Playbook: A Returns Flow That Brings Customers Back

Policy design is the first decision, and it sets everything downstream. Free returns lift conversion at checkout but invite abuse and bloated processing costs. Paid returns filter casual shoppers but cost you sales. The middle ground most high-performing brands use: free returns with an exchange-first default, a 30-day window as the baseline (60 or more for apparel), and store credit as the frictionless fallback when a refund is requested.

After policy comes the mechanics of the flow. A self-service returns portal where the customer enters an order number, picks a reason, and gets an instant label kills support tickets at the source. Carrier choice matters more than it looks: the more drop-off points in the customer's neighborhood, the higher your completion rate. Refund speed is the single biggest satisfaction lever, and refunding on scan, the moment the carrier receives the package, instead of after in-house inspection, is the cheapest trust builder in e-commerce.

The reason codes collected at the portal are not a formality, they are product research. A cluster of "runs small" on a specific SKU is a sizing-chart problem. A cluster of "damaged in transit" is a packaging problem. A cluster of "not as described" is a listing problem. Brands that review return reasons weekly catch issues in weeks that would otherwise surface as review-score slides months later.

Brand-side decision checklist:

  • Handle return-to-sender exceptions
  • Set the policy: free or paid, window, exchange-first, store-credit fallback.
  • Launch a self-service portal with instant label generation.
  • Route carriers by drop-off density, not just sticker price.
  • Refund on scan, or clearly communicate the delay if you refund on inspection.
  • Collect reason codes and review them weekly by SKU.
  • Feed return insights into sizing charts, packaging, and listings.
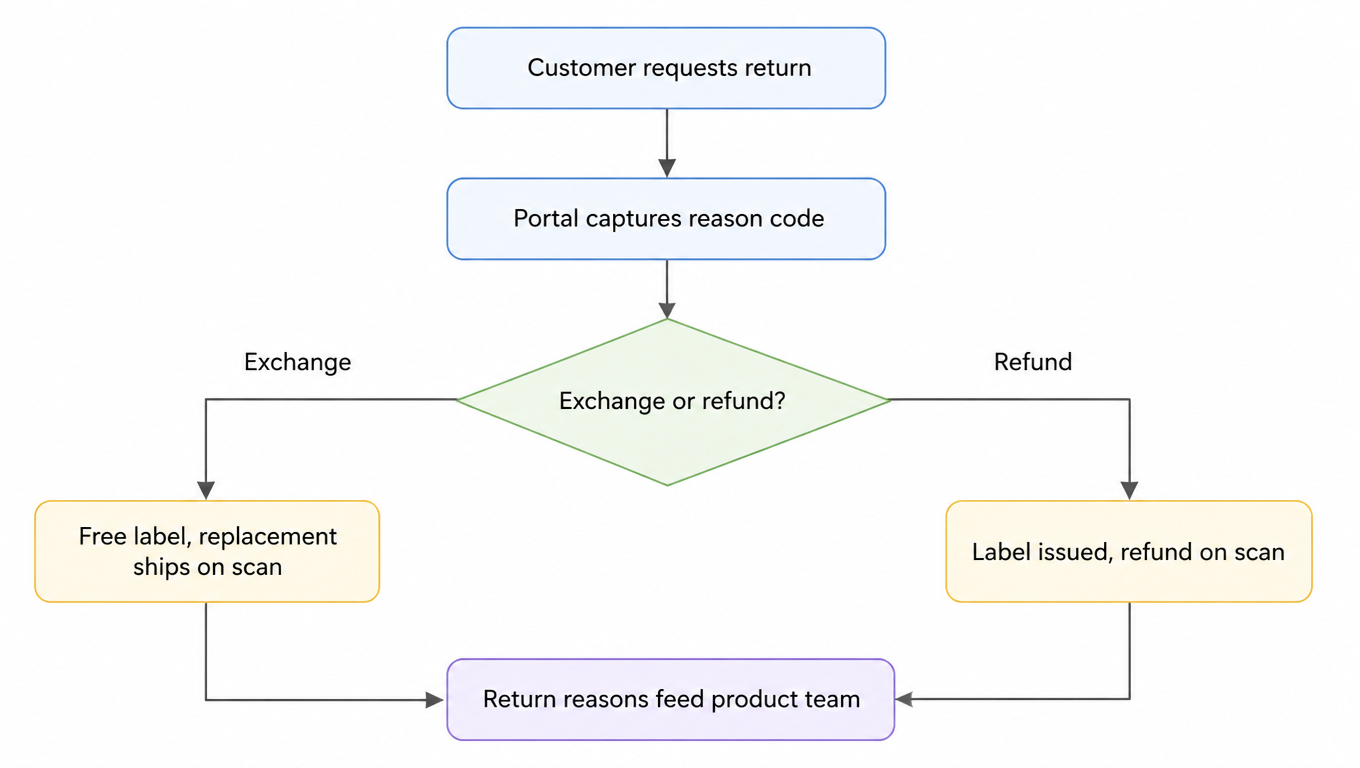
Flowchart of the exchange-first flow: customer requests return, portal captures reason code, branch on exchange or refund; exchange issues a free label and ships the replacement on scan, refund issues a label and refunds on scan; both paths feed return reasons to the product team
The exchange-first returns flow

The 3PL Playbook: Turning Returns Handling Into a Revenue Service

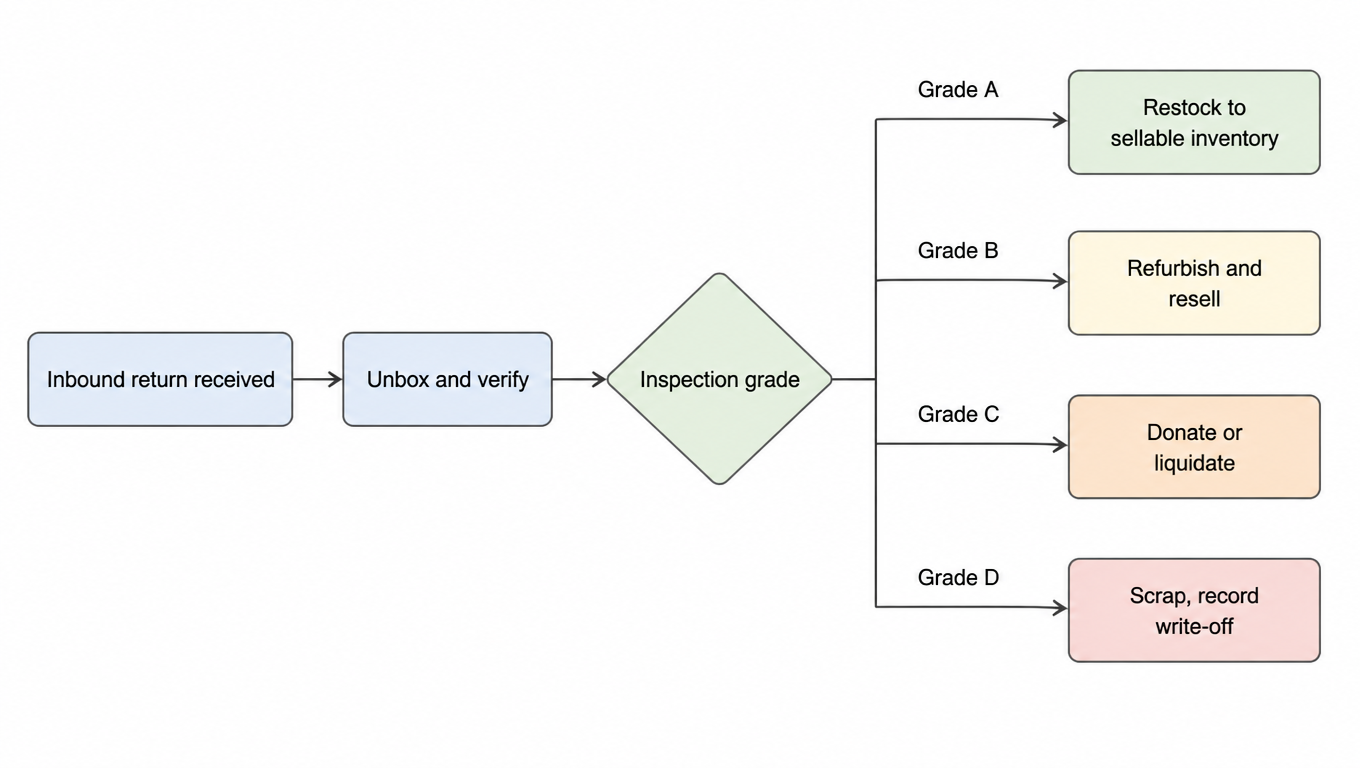
For a 3PL, returns are the most under-priced capability in the warehouse. The same team, racks, and WMS that handle outbound can process inbound returns with a modest set of new standard operating procedures. Receiving, unboxing, inspection, and disposition are the core four steps. The 3PL executes the brand's disposition rules: which condition grades go back to sellable stock, which go to refurbishment, which go to donation or liquidation, and which get scrapped.

The revenue model is a service menu, not a per-package tax. Per-unit processing fees cover the core; value-added services are where margin lives: photo documentation of condition, reason-code capture on the brand's behalf, label generation, refurbishment tiers, and access to liquidation and donation channels. Pricing can be per-unit flat, a la carte per service, or a monthly bundle. SLA commitments close the deal: turnaround time, restock accuracy, and restock rate.

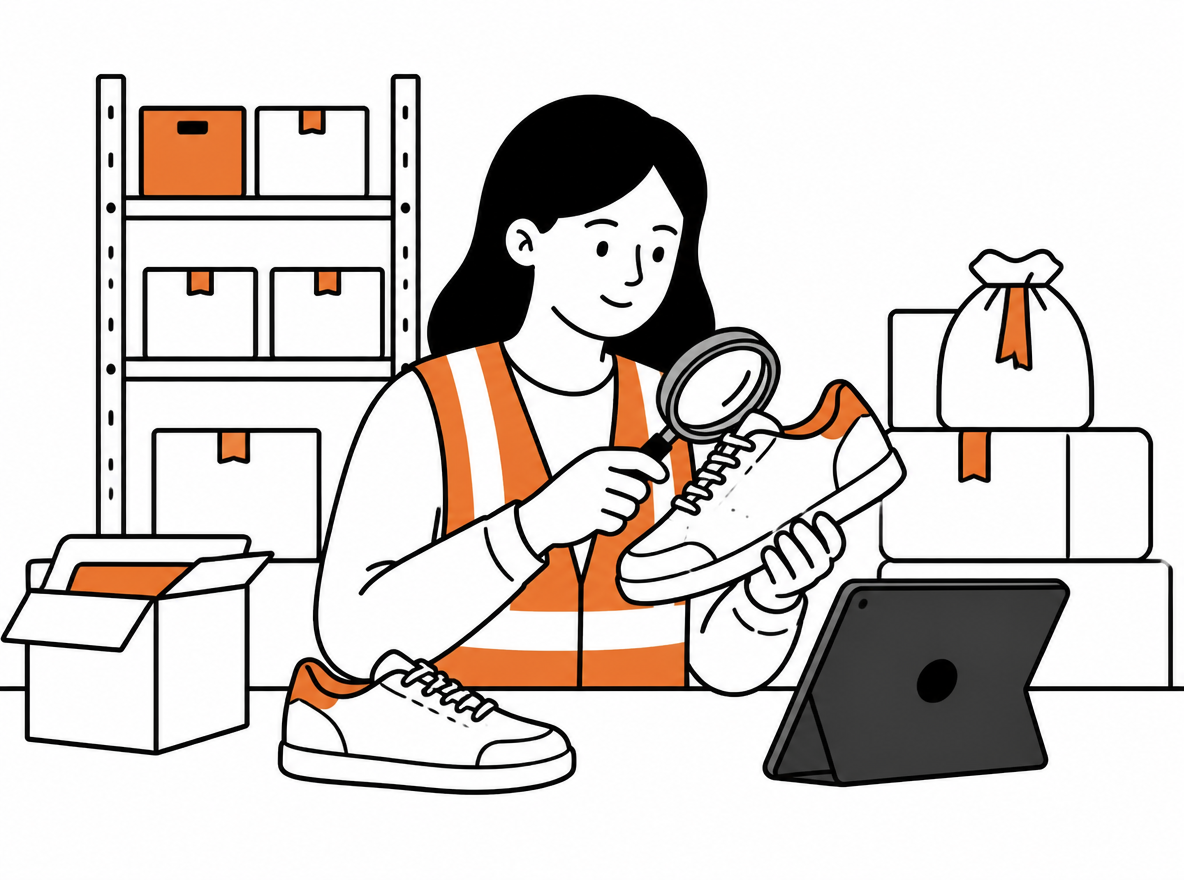
Quality inspector checks sneakers for scratches and wear while entering a grade on a tablet.
Inspection is the bottleneck step that sets restock rate and turnaround
Disposition decision tree: inbound return received, unbox and verify, inspection grade; grade A restocks to sellable inventory, grade B refurbishes and resells, grade C donates or liquidates, grade D scraps with write-off recorded
The inspection-grade disposition tree

3PL service menu and pricing checklist:

  • Core: per-unit receiving, inspection, and disposition execution.
  • Value-added: photo documentation, reason-code capture, label generation, refurbishment tiers, donation and liquidation channels.
  • Pricing: per-unit flat, a la carte per service, or a monthly bundle.
  • SLA: turnaround time, restock accuracy, restock rate, damage claims handling.
  • Reporting: a per-SKU disposition dashboard the brand can pull weekly.

The Brand-3PL Partnership: SLAs, KPIs, and the Data Loop

A returns partnership lives or dies on three contract decisions. Per-unit pricing that rewards speed and accuracy rather than punishing volume. Disposition rules written down, with the brand owning the decision and the 3PL owning the execution. And SLAs that are actually measured: turnaround time from receipt to disposition, restock accuracy, and how disposal costs get allocated.

The dashboard should make four numbers visible weekly: turnaround time, restock rate, cost per return, and post-return customer satisfaction. Per-SKU and per-reason-code breakdowns matter more than the aggregate, because they tell you whether a spike is an operations problem or a product problem.

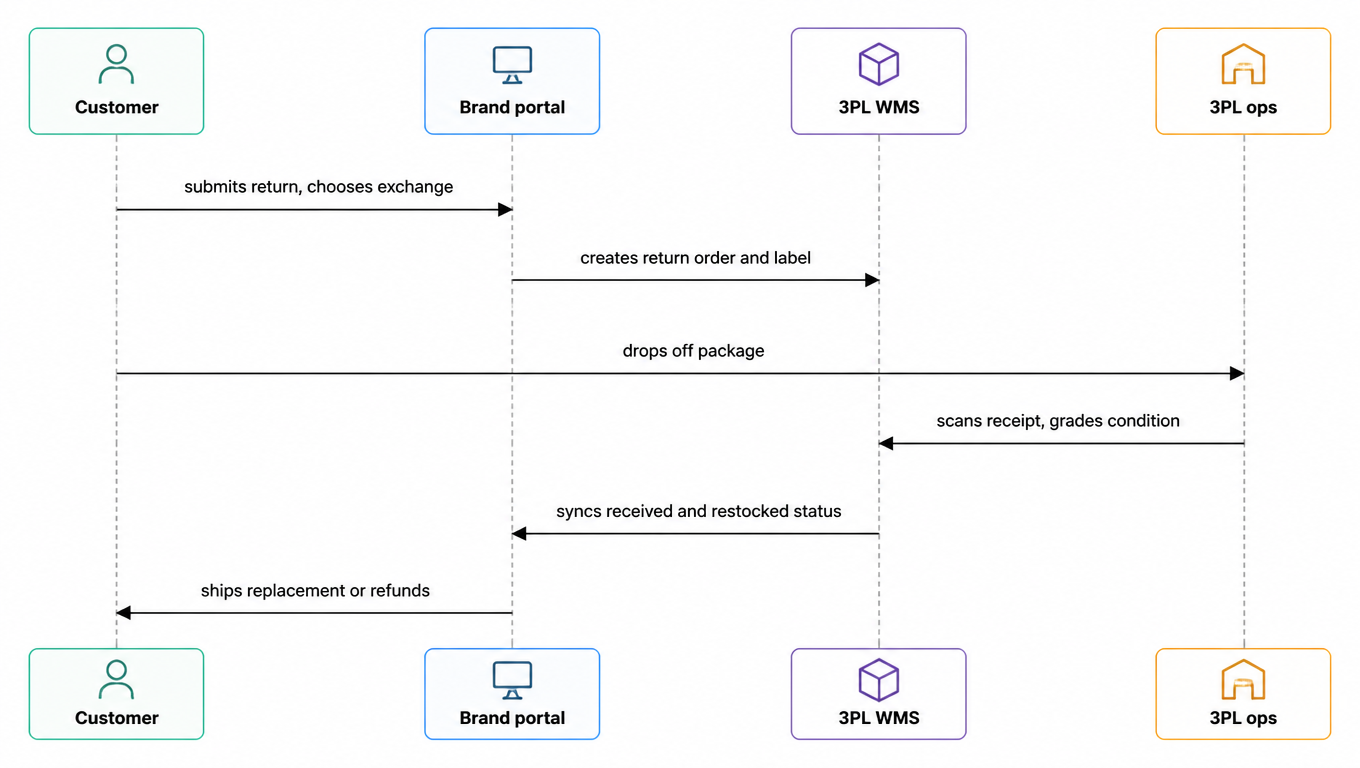
The glue is integration. The brand's returns portal and the 3PL's WMS should talk in real time: the portal creates the return order and label, the WMS reports receipt and disposition status, and the brand's system triggers the refund or replacement automatically. When that loop works, the customer sees live refund status, the brand sees live restock, and the 3PL sees live disposition instructions. Paper labels and spreadsheet handoffs are where the value leaks.

Sequence diagram of the portal-to-WMS data loop: customer submits a return and chooses exchange on the brand portal, portal creates the return order and label in the 3PL WMS, customer drops off the package, 3PL ops scans receipt and grades condition, WMS syncs received and restocked status to the portal, portal ships the replacement or refunds
The portal-to-WMS data loop

Designing Your Returns Strategy: A Decision Checklist

Brand-side decisions come first, in this order: policy, then carrier routing, then scrap thresholds. Policy sets the customer contract. Carrier routing sets drop-off density and refund speed. Scrap thresholds set the financial boundary between refurbish, liquidate, and write off. Write the thresholds down before you negotiate with a 3PL, because they become the disposition rules in the contract.

On the 3PL side, decide service tiers before pricing. Tier one is receiving, inspection, and restock. Tier two adds photo documentation and reason-code reporting. Tier three adds refurbishment and liquidation channels. Price each tier separately, and staff for the inspection bottleneck, which is the step that actually determines restock rate and turnaround.

Launch order:

  1. Lock the policy and scrap thresholds.
  2. Launch the self-service portal with label generation.
  3. Route carriers by drop-off density.
  4. Stand up 3PL receiving with disposition rules and SLAs.
  5. Wire the portal-to-WMS data loop.
  6. Review the four KPIs weekly for the first two months.

The Bigger Picture: Returns as a Growth Channel

The fastest win is the exchange. A replacement order keeps the original revenue and usually keeps the margin, while a refund sends both to a competitor. Brands that default every return to an exchange, and make the exchange path frictionless, recover a meaningful share of return revenue before touching any other lever.

Refurbished resale and liquidation channels close the loop. Open-box and refurbished stock sells for a meaningful share of the original retail price, often 60 to 80 percent, on the brand's own channel or through marketplaces, and donation channels convert unsellable stock into tax value and a sustainability story. Customers increasingly choose brands that keep products out of landfills.

The winning frame: returns are not a tax on e-commerce, they are a retention and revenue channel. Brands that run cost, experience, and revenue in parallel, and 3PLs that sell returns as a service instead of a chore, both win. The question is not how to stop returns. It is how to profit from them, together.

FAQ

Free returns lift conversion at checkout but invite abuse and bloated processing costs. The middle ground most high-performing brands use: free returns with an exchange-first default, a 30-day window (60 or more for apparel), and store credit as the frictionless fallback. Refund on scan is the cheapest trust builder, and it lets the cost of free returns be covered by repurchase value.
Exchange-first. A replacement keeps the original revenue and usually the margin, while a refund sends both to a competitor. Make the exchange path frictionless, default every return to it, and fall back to store credit when a customer insists on a refund.
As a service menu, not a per-package tax. Per-unit processing fees cover receiving, inspection, and disposition; value-added services, photo documentation, reason-code capture, label generation, refurbishment tiers, liquidation and donation channels, carry the margin. Price per-unit flat, a la carte, or as a monthly bundle, with SLA commitments on turnaround, restock accuracy, and restock rate.
Four numbers weekly: turnaround time, restock rate, cost per return, and post-return customer satisfaction. Break them down per SKU and per reason code, because a spike is either an operations problem or a product problem, and the breakdown tells you which.