Obsolete Inventory Guide

Sell Obsolete Auto Parts Online or Locally? Compare Net Recovery After Shipping

Somewhere in your shop there is a shelf of parts that stopped being inventory and started being a storage problem. An alternator pulled from a model discontinued six years ago. A box of sensors bought in bulk for a fitment that never sold. Returns that checked out fine and still did not move. None of them have a local buyer within a practical radius, so the obvious answer looks like a national listing where thousands of shoppers can find the part. The catch is everything between the listing and the cash: packaging, freight, channel fees, and the occasional return can quietly consume most of what the sale was worth.

This guide gives you one formula to compare every disposal path on the same basis, then walks online and local channels through it, and ends with a comparison table you can fill in with your own SKU and real quotes. The point is not to tell you which channel is best in general, because that does not exist. The point is to make the decision measurable before you commit a heavy, awkward, low-demand part to one path.

Hold the shape of the conclusion up front: the path with the higher gross price does not always net more. An alternator listed on eBay at $90 can leave $54 after fees, freight, packaging, and an after-sales reserve; the same unit sold to a local dismantler for $60 costs nothing in freight and puts cash in your hand the same day. Which path wins depends on what you price the wait and the return risk at, not on which path sounds more professional.

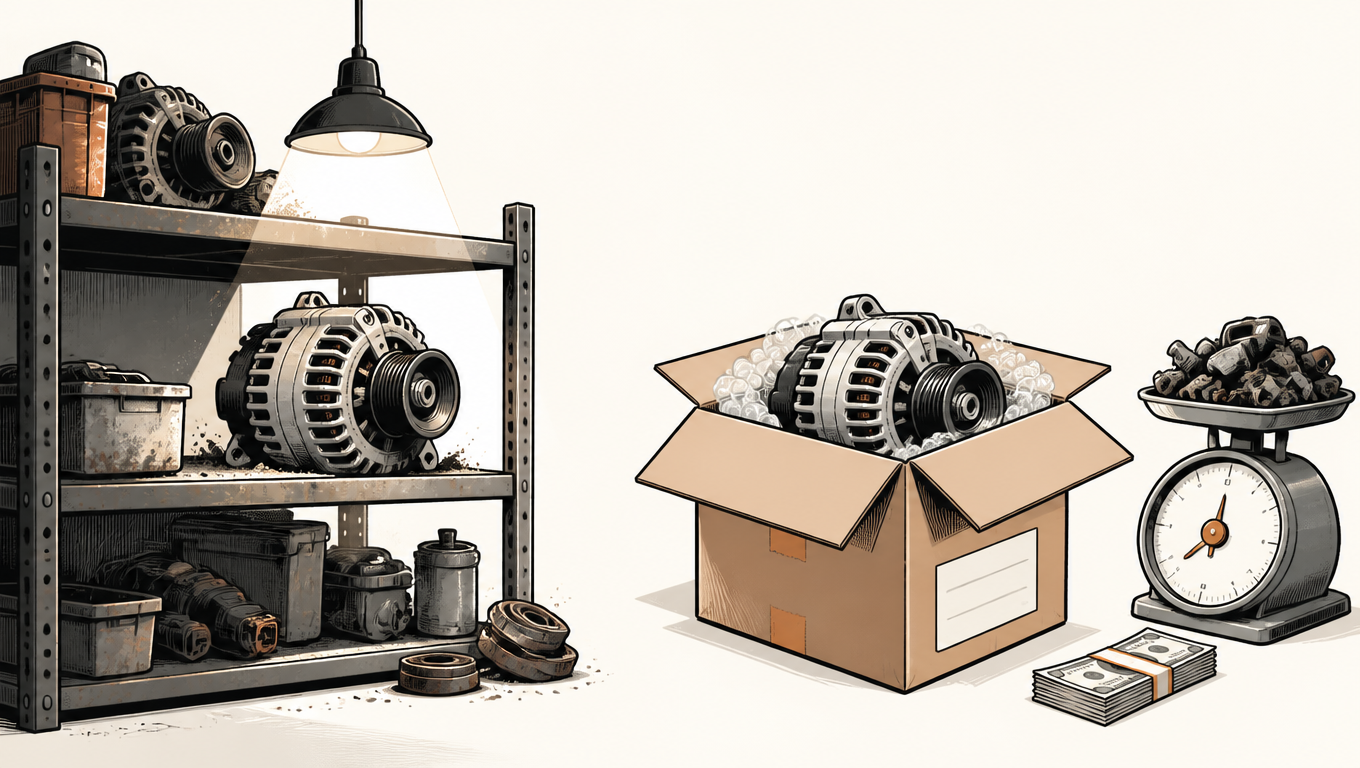
An idle generator and spare parts in a garage contrast with the generator packed for shipping beside cash on a scale.
The widest market is also the most expensive to reach, and it charges freight per unit

The Problem: Dead Parts with Thin Local Demand

A part becomes obsolete for your operation when it has no natural buyer nearby. The car model is out of production, the order was cancelled after the part arrived, or the customer returned it and bought something else. Whatever the reason, the part is still functional and still worth something, but the local market has already said no. Within a realistic radius, only a handful of vehicles even use this part, and most of those are already fixed.

This is what makes auto parts different from most liquidation situations. A dead SKU in clothing can be dumped on a local discount buyer because everyone wears clothes. A dead alternator for a niche model has maybe two potential takers within fifty miles. The buyer pool is national, sometimes continental, and reaching it costs money per unit. The central tension of this article is that the widest market is also the most expensive to reach, while the cheapest local exits pay wholesale prices.

The real question is therefore not "can it sell?" Almost anything sells eventually at some price. The real question is which executable disposition path recovers the most cash for this unit, in the shortest defensible time, for the least work. National listing, local sale, and scrap all deserve a seat at that comparison.

Why the Usual Tests Mislead

Three quick tests dominate how people actually decide, and each one fails on its own.

"It will sell" is not a decision. Sellable is not the same as worth selling once you price in your time, the freight risk, and the alternatives. A part that sells for $40 after six weeks of listing fees and a return scare may recover less than the $60 a dismantler offered on the spot.

"Price is above freight" undercounts badly. Freight is one line item, and often not the biggest one. Channel and payment fees, packaging materials, your handling labor, and expected after-sales losses all sit on top of it. A part that clears its freight by $15 can still net negative once the full stack is counted.

"Margin looks fine" measures the wrong thing. Gross margin prices a sale; it was designed for a business selling normally. A disposition decision is about the incremental cash each path returns for a unit you already own and already failed to sell through normal channels. Those are two different numbers and they serve two different questions.

So keep them separate. The incremental cash comparison asks: what does each disposal option net, right now, for this unit, including the cost of waiting? Full order profit accounting asks: what does a normal sale of this product contribute to the business? When you price the inventory write-down, the freight, and the return risk into a dead part, you are doing disposition math. Comparing that number against your normal gross margin will make every path look bad, because it is a different calculation. Compare paths on the incremental basis, and track waiting cost and end-of-horizon residual value separately.

One Comparison Unit, One Net-Recovery Formula

To make any of this comparable, fix four things first: one SKU, one disposition path, one destination scope, and one evaluation horizon. Compare the alternator against the junkyard quote over ninety days, then against the eBay scenario over ninety days. Do not compare the alternator on eBay to a different part sold locally, and do not let one path run for a week while another runs for a year.

For a single completed sale, net recovery is defined as:

Net recovery = proceeds received (goods + buyer-paid shipping) − channel and payment fees − incremental packaging and handling − actual transport cost − expected after-sales net loss

Every term needs a consistent basis. If a return is possible, decide once whether the recoverable part value is counted at the sale or at the return, and never deduct it in both places. Return freight, when it happens, belongs in the after-sales line, not in transport cost, or you will double-count it. The refunded sale price comes out of proceeds; the part you get back is not additional revenue on the same transaction.

The unsold scenario gets its own two lines instead of vanishing. First, waiting cost: the capital tied up in the part, the storage it occupies, and the management attention it keeps stealing, carried to the horizon date. Second, residual disposition value at the end of the horizon: what the scrap yard or dismantler will actually pay on that date. A path that nets $10 after fourteen weeks is not obviously better than one that nets $8 today, because the $8 is in your hand now and the $10 still carries fourteen weeks of waiting risk.

Where the probability of a sale is unknown, and it usually is for obsolete parts, run scenario analysis instead of inventing confidence. Build an optimistic, a base, and a pessimistic case from your own records and real quotes, and let the ranges drive the decision. If you have no data at all, that is a finding, not a license to assume an industry average. The next section says exactly which numbers you need and how to get them honestly.

Price Every Variable per SKU, Honestly

Seven variables decide the outcome, and each must be priced for this specific part, not for "parts in general."

Realizable price and actual receipts. Look at recently sold listings for comparable parts, not active asking prices. Then subtract what the buyer really pays you: buyer-paid shipping is proceeds, seller-paid shipping is a cost, and the split changes the arithmetic of every channel.

Condition and documentation. Photos, OEM numbers, and fitment data are not decoration, they are price. An incomplete listing competes in a lower bracket because buyers discount uncertainty. For a rare part, documentation can be the difference between a sale and a six-month listing.

True packed dimensions and weight. Carriers quote on the box, not on the bare part. An alternator on a pallet is a different product from an alternator in an 18 × 14 × 12-inch box, and the dimensional weight can exceed the physical weight by a wide margin. Weigh and measure the packed unit before you price any path.

Serviceability and destination. Not every ZIP can be served at small-parcel rates. Some destinations only work via LTL or regional carriers, some not at all. Define the served scope before you list, so you never discover the constraint inside a paid order.

Packaging and handling labor. Materials plus your time, priced as a real cost. If it takes you forty minutes to crate a door safely, that is a line item, not a hobby.

Channel and payment fees. Final value fees, listing fees, payment processing, and any promoted-listing spend. These differ meaningfully between channels and scale with price, so they change the ranking of paths.

Expected after-sales net loss from your own records. Return rate, transit damage rate, and handling cost per incident, taken from how your own listings actually behaved. If you have no records, widen the range and collect data on the first few sales, rather than inventing a tidy number.

Time to sale. Historical time-on-market for similar parts tells you how long the national route really takes. If the part cannot wait, fold the deadline into the liquidation offers you compare against, because "sell now at $60" beats "maybe sell at $90 in four months" once waiting cost is priced.

The Same Formula Across Paths: Online versus Local

Run every path through the identical formula, term by term, and only then compare the rows.

Online national listings: eBay and Facebook Marketplace. These reach the largest buyer pool and usually the highest achievable price, which is why they are the default answer. eBay charges final value fees on the total, including buyer-paid shipping,[1] and comes with the platform's dispute and return machinery. Facebook Marketplace is cheaper in fees[2] and feels more local, but its audience, messaging workflow, and buyer seriousness vary by category, and its protections are thinner. On both, the formula changes in three places: fees, actual freight on a packed heavy part, and a materially higher after-sales line, because remote buyers return and dispute at rates local cash buyers never do.

Amazon, briefly, to dismiss it. Used auto parts sit inside category restrictions and selling policies that make one-off sales by individuals rarely worthwhile.[3] For the seller this guide is written for, Amazon is normally a research source for prices, not a disposition path.

Whichever online channel you take, decide up front who pays the freight, which service carries it, and which ZIPs you can serve. Boxing and labeling a heavy part is a job in itself; make freight the smallest line item instead of the one that surprises you later. The mechanics live in our guides to auto parts parcel shipping costs and marketplace prepaid labels, build vs buy.

Local exits: dismantlers, scrap, independent shops. A junkyard or dismantler buys the part at wholesale for immediate cash. There is no freight, no packaging, no returns, and the transaction takes minutes. Scrap metal sets the recovery floor: if the part's only value is its metal, scrap price is what it is worth, and every other path must beat that number to justify its effort. Independent repair shops and parts stores occasionally buy specific parts they know they can place, usually at a discount to retail but above scrap.

The local rows look worse on price and better on everything else: certain, immediate, near-zero work or risk. That is exactly what the formula should show. The mistake is comparing local wholesale price to online gross price without running both through the full stack. When you do, heavy parts, low-demand parts, and parts with poor documentation frequently flip to the local column, while light, documented, nationally demanded parts stay online. If you are pricing a SKU across several selling venues at once, our multichannel readiness framework covers the hidden shipping costs of adding a channel.

Decision Framework: Route by Evidence, Not Instinct

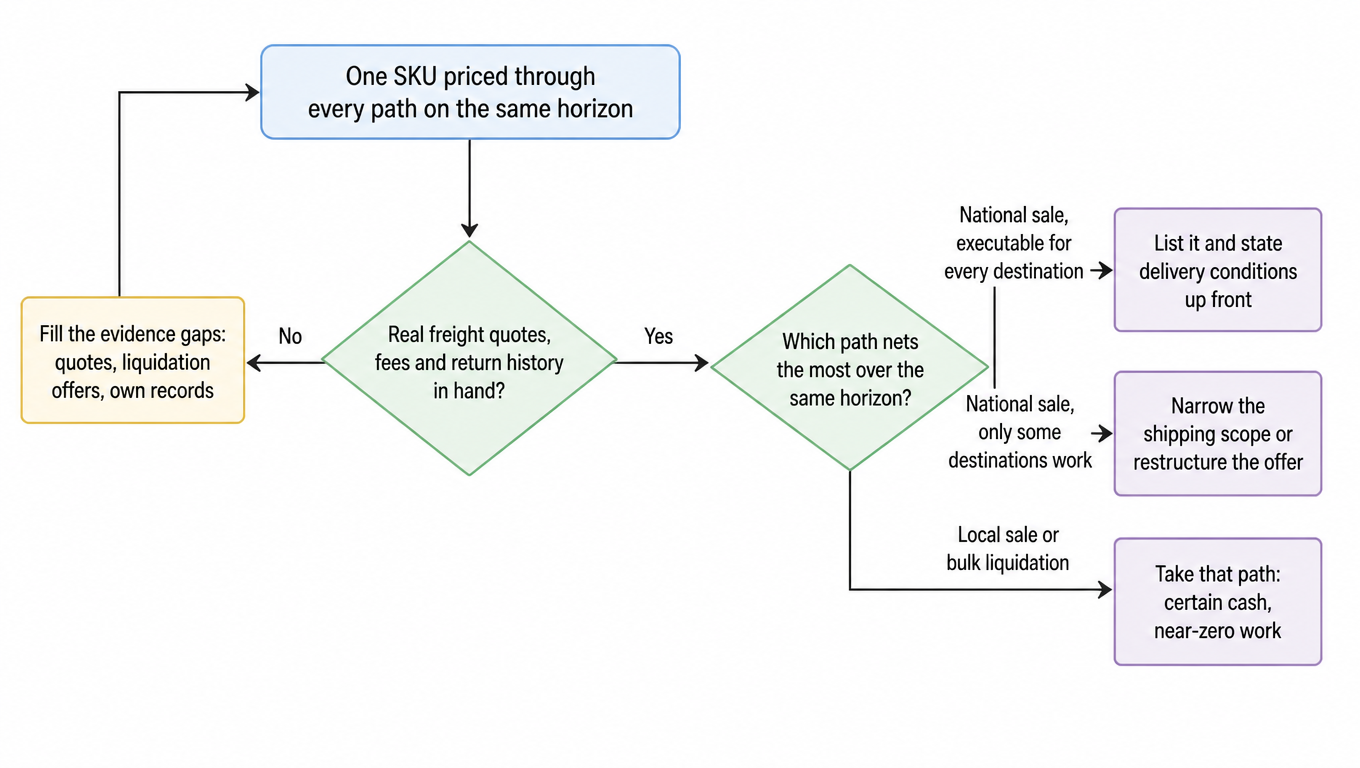
Once every path is priced on the same basis, the routing decision collapses into a short table. The golden rule is that you only choose when the evidence is complete. An unpriced freight quote, a missing liquidation offer, or no return history is not a reason to guess, it is a reason to collect the missing data first.

Decision flowchart: price one SKU through every path on the same horizon; are real freight quotes, fees, and return history in hand (no: fill the gaps and recompute); which path nets the most over the same horizon; national sale executable for every destination then list and state delivery conditions; only some destinations work then narrow the scope or restructure the offer; local or bulk liquidation wins then take that path
Complete the evidence first; then compare net recovery over the same horizon
If the evidence says Then
National sale nets more and shipping is executableList it, and state delivery conditions up front: packed size, service used, destinations served
Only some destinations workNarrow the shipping scope or restructure the offer within channel rules, for example split freight out or restrict served ZIPs
Local sale or bulk liquidation nets more, faster, or easierTake the alternative path and stop spending attention on the part
Packaging, eligibility, fees, or demand evidence is thinCollect the missing data before deciding; the cheapest error is a free quote

The freight quote is the cell most often missing from this table, and the one most likely to change the answer. Regional carriers can rewrite the outcome on heavy lanes inside their coverage; our guide to when regional carriers save money shows how to tell, and our umbrella guide to lowering shipping costs covers the freight bill as a whole.

A Fill-In Disposition Comparison Table for Your SKU

Two tables follow. The first is empty: one row per disposition path you are actually considering, with the horizon fixed across all rows. The freight column comes from real quotes for your packed dimensions, weight, and destination, never from estimates, because freight is the line item most likely to flip the answer for a heavy part. If you are comparing several destinations for the same path, run one row per destination scope.

Path Proceeds received Channel & payment fees Freight (real quote) Packaging & handling Expected after-sales loss Time to cash End-of-horizon residual Net recovery

The example rows below are illustrative only: the numbers exist purely to show how the arithmetic fits together and do not represent any market price, fee schedule, or freight rate. Replace every value with your own quotes before trusting the row.

Path Proceeds received Channel & payment fees Freight (real quote) Packaging & handling Expected after-sales loss Time to cash End-of-horizon residual Net recovery
Example: alternator, local dismantler (illustrative numbers only)$60$0$0$0$0same day$0 (cash in hand)$60
Example: alternator, eBay national (illustrative numbers only)$90 incl. buyer-paid shipping$15$8$7$6~35 days$0 (sold)$54

The same alternator shows $60 in hand today versus $54 after a five-week wait with return risk still in the window. If the $60 offer expires, or the national sale probability is genuinely high, the ranking changes, which is precisely why you compare on one horizon with real numbers rather than on reputation. Run the freight comparison through a channel-neutral carrier comparison across UPS, FedEx, USPS, and regional options, which is what a tool like the EasyShippingX Portal, Excel, or API provides, so no carrier's rate card decides your answer before you see the alternatives. Try a rate now with the shipping rate calculator.

When a part refuses to clear even the honest version of this table, scrap value is not failure, it is the floor the whole exercise was built on. When the freight itself is the mountain on a heavy part, our framework on reducing auto parts parcel shipping costs is where to keep reading.

Fill in the freight quotes before you decide where to sell

EasyShippingX is a channel-neutral shipping layer: one consistent way to compare US domestic carrier options and execute through a portal, a spreadsheet, or an API. When you price an obsolete part, pull real quotes from it for your packed dimensions, weight, and destination, and turn the freight cell in your net-recovery table from an estimate into a number; see how UPS, FedEx, USPS, and regional options differ before you decide whether a national listing is worth it. See pricing or book a demo.

FAQ

Not necessarily. Online usually reaches a higher gross price, but the ranking only shows after you deduct channel and payment fees, real freight, packaging and handling, and a materially higher after-sales line on the same basis. Heavy parts, low-demand parts, and poorly documented parts frequently flip to the local column once the full cost stack is run; light, documented, nationally demanded parts stay online. The judge is net recovery over the same horizon, not gross price.
Because the gross price and the freight are both visible, which makes the comparison look easy, while the rest of the stack (channel fees, packaging labor, after-sales reserve) hides behind them. And because carriers quote on the box, not the part: a different box, lane, or carrier can move freight on a heavy part by twenty to thirty percent, yet sellers habitually fill that cell with an estimate instead of a real quote. On heavy parts, freight is the line most likely to flip the answer of the whole table.
Scrap value is the recovery floor: if a part's only value is its metal, scrap price is what it is worth, and every other path must beat that number to justify its effort. It is not failure; it is the floor the whole net-recovery exercise stands on. Dismantlers and scrap yards pay wholesale for immediate cash with no freight, packaging, or returns, and they are the most certain exit when the cost of waiting is high.
Run scenario analysis instead of inventing confidence. Build an optimistic, a base, and a pessimistic case from your own records and real quotes, and let the ranges drive the decision. Having no data at all is a finding, not a license to assume an industry average: fill the gaps first (free freight quotes, liquidation offers, real behavior from the first few sales), then decide.
It is a channel-neutral shipping layer that compares US domestic carrier options through a portal, a spreadsheet, or an API. In the net-recovery table it turns the freight cell from an estimate into real quotes: enter the packed dimensions, weight, and destination and see UPS, FedEx, USPS, and regional options at once, with no single carrier's rate card deciding for you. Once the freight is filled in, whether the national listing is worth it answers itself.