Fulfillment Decision Guide

Hire More Warehouse Staff, Automate Shipping, or Outsource Fulfillment? A Break-Even Framework

Growth is the problem you want to have, until it becomes the problem you have. Orders climb, and the team that used to finish by 3 p.m. is now picking into the evening. Packages pile up past the pickup cutoff. The same order gets typed into three carrier portals because nobody wants to re-key it a fourth time. Carrier choices get made under pressure, and the cheapest option is whichever tab happens to be open. Every one of these symptoms says the same thing: the operation has run out of capacity.

Management's response is usually to pick one of three levers: hire more warehouse staff, buy shipping automation, or hand the whole thing to a 3PL. All three are legitimate answers, and all three are frequently wrong for the specific situation, because the decision gets made on volume ("we ship 200 orders a day, time to outsource") rather than on diagnosis ("we lose 40 minutes a day to portal re-entry and we miss cutoffs").

This guide gives you a break-even framework that treats the three options as competing operating models and compares their full monthly cost across Base, Peak, and Growth volume scenarios, with SLA guardrails. The goal is not to tell you which option is best. The goal is to show you the numbers you need to collect and the math you need to run, so the decision survives contact with your actual order data. It also separates the three results any one of those options can buy, cash saved, hours freed, and capacity added, counts each on its own terms, maps the bottleneck you observe to the option worth testing first, and runs one small pilot before you scale.

Manager stands between three busy packing stations in a small warehouse late at night.
Growth is the problem you want to have, until it becomes the problem you have

Why Daily Order Volume Is the Wrong Metric

The most common framing is "at X orders per day, outsource" or "at X orders per day, automate." Daily average volume is a convenient number, but it is the wrong input for this decision, for three reasons. First, averages hide the shape of demand. A store doing 200 orders a day might see 60% of them arrive in the three hours before the pickup cutoff, run a 3x spike every Monday, or do 2.5x volume in Q4. Capacity decisions are made at the peak hour and the peak week, not at the average. Second, each option fixes a different bottleneck, and picking the option before locating the bottleneck guarantees a mismatch. Shipping automation replaces keystrokes in carrier portals and label generation; it does nothing for a picking process slowed by disorganized storage and bad pick paths. Hiring more staff adds hands to the picking line, but two people re-entering the same order into three portals is not a labor problem; it is a process problem that extra headcount makes more expensive, not faster. Third, a 3PL is a different operating model, not a magic fix: if your carrier economics are bad, your data is locked in spreadsheets, or your reconciliation takes a week, those problems follow you into the 3PL relationship.

The implication: volume is the trigger to ask the question, not the answer to it. Before choosing an operating model, you need a diagnostic step that locates where the bottleneck actually sits.

A flat average line contrasts with a sharply fluctuating hourly curve on a chart beside a coffee cup.
Averages hide the peak, and capacity decisions happen at the peak

Three Outcomes, Not One: Cash Saved, Time Freed, Capacity Added

Once you accept that volume alone cannot pick the option, the next question is what the money is actually buying. A part-time hire, a better shipping workflow, and a 3PL are three different purchases, but each of them can produce only three kinds of result, and each result has to be counted differently. Blending them is how a fulfillment investment gets approved on paper and then fails to show up in the numbers three months later.

The first result is cash saved: money you stop paying. Postage, overtime, packaging, outsourced processing, error rework. This is the only result that lands in the P&L as a saving, because it changes an amount that was actually leaving the business.

The second is time freed: hours your team, or you, no longer spend entering addresses, comparing services, printing labels, packing, and chasing exceptions. Freed hours become money in exactly two cases. Either you actually reduce paid hours or overtime, or those hours get redirected to work that produces revenue or removes risk, and that redirection happens on a schedule instead of staying a good intention. Otherwise they are slack with a story attached, not a saving. Twelve hours a week back sounds like a raise until you notice nobody was paid for those twelve hours in the first place.

The third is capacity added: the same shift ships more orders, or finishes more of them before the cutoff. Capacity is worth something only when demand fills it, which shows up as fewer late shipments, fewer broken promises, and the incremental orders you can now accept. If the incremental orders never arrive, capacity is insurance rather than income. Insurance can still be the right purchase, but it is not a return.

ResultWhat it changesWhen it countsThe usual miscount
Cash savedAmounts you actually pay: postage, overtime, packaging, processingA payment falls or disappearsTreating a lower quote as a saving already realized
Time freedHours on address entry, rate comparison, labels, packing, exceptionsPaid hours or overtime actually fall, or the hours go to work with a date on itConverting freed hours into wage savings without removing one paid hour
Capacity addedOrders the same shift finishes and hands over before cutoffDemand fills it: fewer late shipments, more orders acceptedReading "can ship more" as "will earn more", or counting the same hour twice

Three rules keep the three results from blending into one optimistic number. Do not count the same hour twice: once a labor hour is booked as a wage saving, that same hour cannot also be booked as the revenue from work done in it. Do not discount freed hours at an hourly wage unless the paid hours are gone, because a schedule with slack in it is not a payroll reduction. And do not compare a realized cost against an unclaimed benefit: the current operation's bill is real, while the alternative's saving stays a projection until a pilot says otherwise. Verify each result with its own instrument rather than the same spreadsheet: cash against invoices and payments, time against actual time records, and capacity against orders completed before cutoff.

A hand-drawn editorial illustration of a small-business owner at a desk with an open ledger and three loose stacks beside it: receipts, a small clock, and a row of parcels waiting to ship.
The same spend, three outcomes, each booked a different way

Diagnose the Bottleneck First: A Three-Zone Map

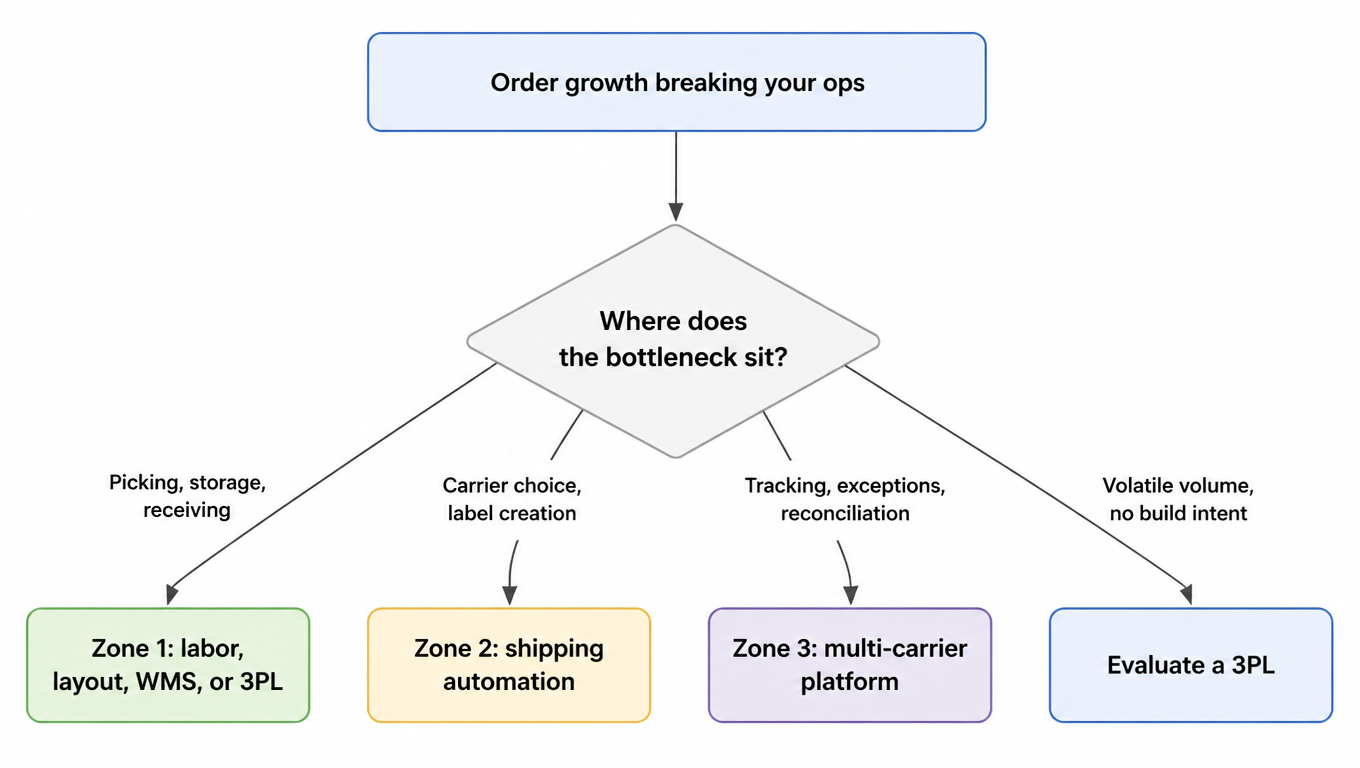
Split your fulfillment operation into three zones, each with its own failure modes and its own remedies. Zone 1 is receiving, storage, and picking: physical work, warehouse layout, and inventory accuracy. Its remedies are labor, layout changes, a WMS, or handing the physical operation to a 3PL. Zone 2 is rate shopping, carrier selection, and label creation: decisions and keystrokes. Its remedies are shipping automation, rate-shopping logic, and label automation. Zone 3 is tracking, exceptions, and reconciliation: everything that happens after the label prints. Its remedies are a multi-carrier platform or API that gives you a single view of tracking, exception handling, and billing reconciliation. To stress-test Zone 1 capacity gaps systematically, run the double-volume stress test in our guide to ecommerce shipping capacity planning; for the line-by-line reconciliation discipline of Zone 3, see our shipping reconciliation guide.

Most growing sellers do not have one bottleneck; they have a primary one with a mess behind it. The diagnosis still needs to be honest about where the constraint sits, because the remedy for Zone 2 does nothing for Zone 1, and the remedy for Zone 1 does nothing for Zone 3.

There is a fourth path that sits outside the zone map: if volume is highly volatile and you have no desire to build fulfillment capability at all, evaluate a 3PL directly. Fixed in-house capacity is the wrong asset for a demand curve you cannot predict, and a 3PL converts that fixed cost into a variable one. For how to pick and run a 3PL relationship itself, see our guide to 3PL shipping operations.

Flowchart: order growth breaks operations, the bottleneck branches to Zone 1 (labor, layout, WMS, or 3PL), Zone 2 (shipping automation), Zone 3 (multi-carrier platform), or evaluate a 3PL directly for volatile volume with no build intent
Locate the bottleneck before you choose the operating model

From Bottleneck to First Test: What to Try First

The choice is not the cheapest option or the one with the longest feature list. It is the option that actually changes the step where the work is queuing, which is why the same purchase can be correct in one operation and wasted in another. Map the bottleneck you observed to the option worth testing first, and decide in advance what acceptance looks like.

Observed bottleneckOption to test firstWhat acceptance looks like
Orders pile up in picking and packingPart-time labor or outsourced fulfillmentOrders actually completed before cutoff, plus error and supervision cost
Hours go into re-entry, rate comparison, and label creationA better shipping workflow: rate logic, label automation, one place to workManual touches per order, time per order, consistency of the charges applied
Parcels are ready but not handed over in timePickup schedule or carrier mixHandovers that succeed on time, not the number of labels printed
Several steps fail at onceA staged combination, one constraint per stageWhether each investment removed the bottleneck it was aimed at

The right-hand column is the part that gets skipped. A lower quote is not acceptance, and a feature list is not acceptance: the test passes when the step that was queuing stops queuing. If the cheapest option cannot change that step, it is not spending money on the bottleneck at all. A rate comparison tool does nothing for a picking line that cannot find its stock, and two extra packers do nothing for an order that has to be typed into three carrier portals.

Two disciplines follow. Test one bottleneck at a time, and when several steps fail at once, sequence them so each investment has a single target and a measurable result; an improvement that cannot be attributed to one change is not evidence. And judge the handover on handovers: if parcels are staged and the truck leaves without them, printing more labels or buying more software has improved nothing the customer can see.

The Variables That Actually Drive the Decision

A break-even comparison only works if every cost that actually moves is on the table, in all three scenarios, measured the same way. Start with volume shape: base monthly volume, your busiest month, your peak-hour rate (orders in the two hours before cutoff), and expected growth over the next 12 months. These four numbers feed every scenario below, and they are why "orders per day" was never enough.

Then measure your internal operation: labor minutes per order in each zone, fully loaded hourly cost (wage, payroll tax, benefits), overtime at 1.5x[1], training time for a new hire, and turnover. Count errors separately: reprints, rework, lost parcels, and the hours spent resolving them. Add your complexity: number of sales channels, warehouses, and carriers, because every extra portal multiplies duplicate work in Zone 2. Parcel profile matters too: average weight, zone spread, and dimensional weight[2] determine how much rate shopping can actually save, because a uniform single-zone parcel mix has little to win.

Two variables go missing most often, and both change the answer. Count the founder's own hours in the same table as everyone else's, in the same units: twelve hours a week spent re-entering labels is a real cost of the current mode, even when it never appears on a payroll. Record routine and exception orders separately, because exceptions (missing or unverifiable addresses, payment reviews, damaged stock, split shipments) consume a multiple of the labor a clean order takes, and blending the two hides the number that is actually growing with volume. Then write down what the freed hours will be used for, concretely enough to schedule: hours with no destination are slack, not a saving. Finally, record the handoff window your operation has to hit and the service eligibility your parcel mix has to meet, because a workflow that produces a label after the truck leaves has improved nothing.

Then price the alternatives honestly. Software and integration: one-time implementation, monthly subscription, and the engineering support you will actually need. A 3PL quote should come in writing with every line item: receiving per SKU or pallet, storage per pallet per month, pick-and-pack per unit, postage pass-through, returns processing, and minimum charges[3]. "All-in" quotes hide where the margin lives.

Finally, set guardrails before you run any math: SLA terms (cutoff times, on-time percentage, error rate, exception response time), data control and export, exception ownership, and migration reversibility, meaning what it costs to leave, in the agreement and in practice. And hold one principle above all: use your own data. Every number in the framework below is a placeholder for the one you measure in your own operation. Industry averages are for decks, not for decisions, because your parcel profile, your labor market, and your demand shape are not average.


The Break-Even Framework: Three Full-Cost Scenarios

With the variables collected, build three full-cost scenarios, deliberately parallel so the comparison is apples to apples. Scenario 1, keep hiring, is fully loaded labor plus overtime plus training plus errors and rework, on top of your current shipping cost; hiring adds capacity to do the same work more times, and it never touches the shipping line itself. Scenario 2, automate shipping, is residual labor (what remains after label creation and carrier selection are automated) plus software and integration cost plus engineering support plus post-routing shipping cost after rate shopping; automation changes the per-order economics of Zone 2 and shaves the shipping line, which hiring never does. Scenario 3, outsource to a 3PL, is receiving plus storage plus pick-and-pack plus shipping plus returns plus minimums plus the internal vendor-management cost of running the relationship; the 3PL replaces Zones 1 and 2, but it also adds a management layer and bills you for every touch. For the break-even math of automating Zone 2 itself, see our guide to rate shopping automation break-even; for what drives the shipping line itself and how to compress it, see our guide to lowering shipping costs.

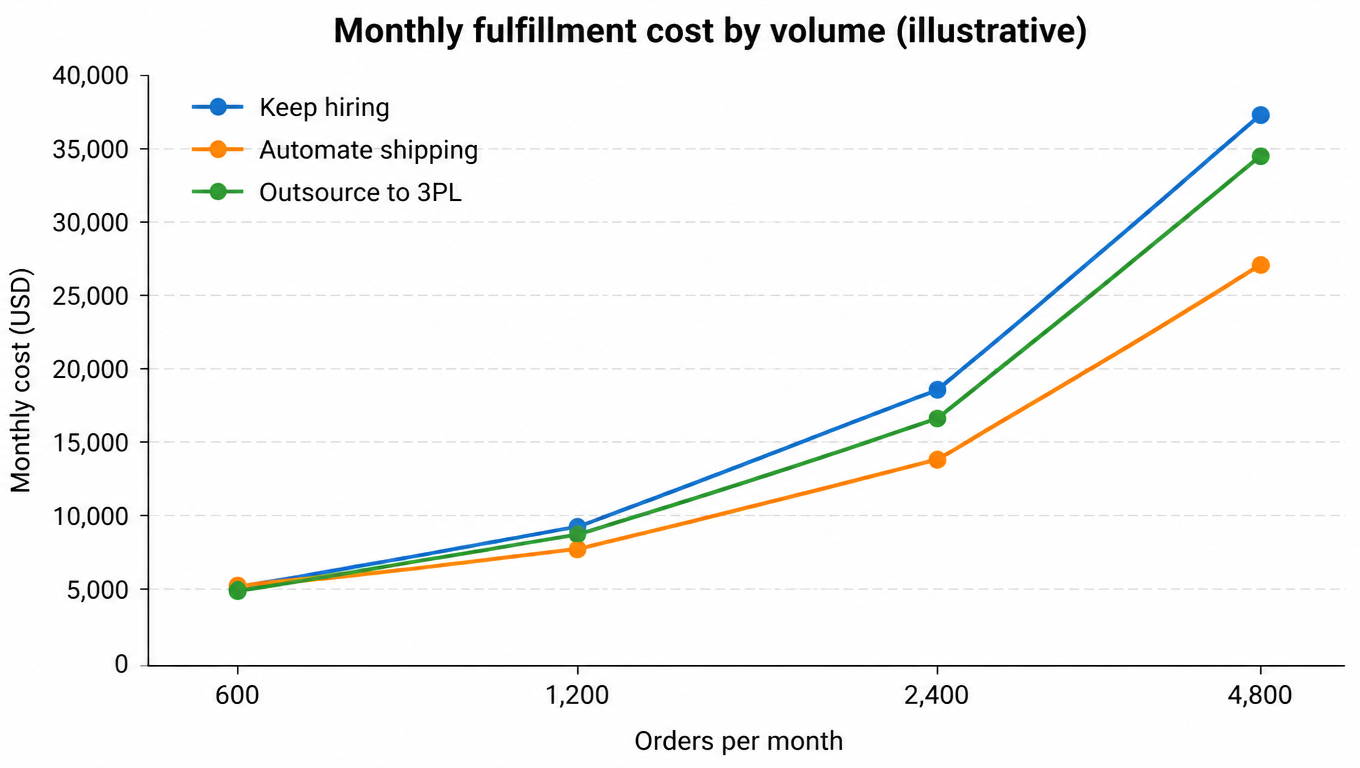
A worked example, with deliberately round illustrative numbers you should replace with your own. Say your current shipping averages $5.50 per order. Staying in-house costs about $2.20 per order in fully loaded pick-and-pack labor plus $400 a month for existing space, so keep-hiring totals 400 + 7.70 per order. Automation runs $2,000 a month amortized (software, integration, engineering support), cuts label labor to $0.40 per order, and rate shopping brings post-routing shipping to $4.90, so automate totals 2,000 + 5.30 per order. A 3PL quotes $600 a month in minimums and $7.20 per order all-in, so outsource totals 600 + 7.20 per order. Run all three at 600, 1,200, 2,400, and 4,800 orders per month.

Line chart: monthly fulfillment cost from 600 to 4,800 orders per month across keep hiring, automate shipping, and outsource to 3PL; automation is cheapest at high volume
In the example numbers, automation wins above roughly 750 orders a month

The crossing points tell the story, in this example. Below roughly 400 orders a month, staying in-house with existing staff is cheapest. Between about 400 and 750 orders a month, the 3PL wins on paper, because the minimums spread thin and you avoid the fixed software bill. Above roughly 750 orders a month, automation overtakes both and the gap widens with volume, because its per-order cost stays flat while the other two scale with every order.

Now run all three scenarios at Base, Peak, and Growth, not just current volume: Base is this month, Peak is your heaviest month, Growth is your 12-month projection. Apply the SLA guardrails before you read the totals: if a scenario misses cutoff coverage, the on-time target, or the error ceiling at Peak, it is disqualified on operational grounds regardless of the spreadsheet. And never compare nominal cost per order alone. A cheap per-order number that fails every November is not cheap.

Verify Small First: Run One Pilot Before You Scale

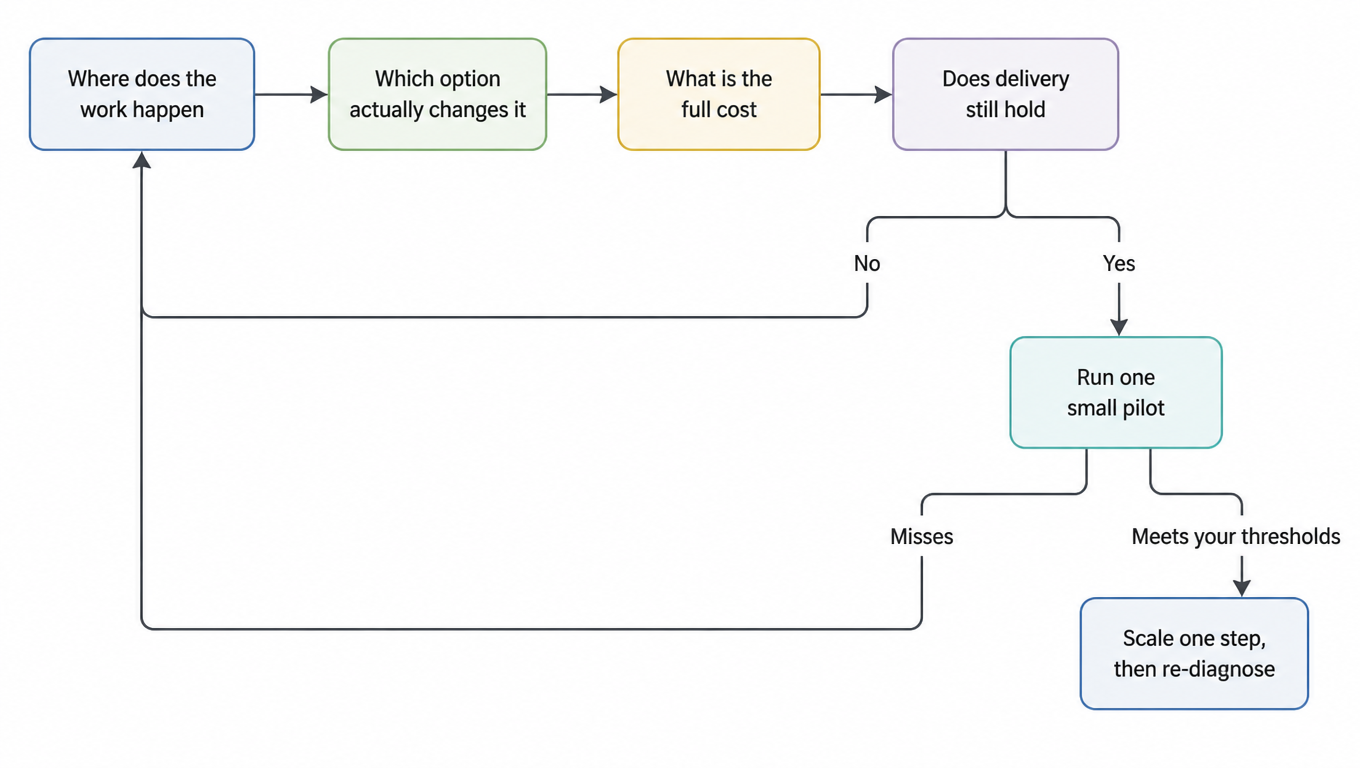
Pull the whole chain together and it has five links, walked in order: where the work happens, which option actually changes it, what the full cost is, whether delivery still meets the promise, and whether one small pilot justifies scaling. The order matters, because each link disqualifies candidates for the next one, and because the cheapest option that fails a delivery check was never a candidate in the first place.

Flowchart: where the work happens, which option actually changes it, what the full cost is, whether delivery still holds; failing returns to the start, passing runs one small pilot, and meeting your thresholds scales one step before re-diagnosing
Five links in order; miss one and the chain returns to the diagnosis

Design the pilot so it compares the current mode with the candidate mode directly: the same orders over the same period, or orders split between the two, rather than this month against last month, because demand shape moves and the comparison dissolves with it. Record, per order and separately for routine and exception orders, the actual labor minutes, the actual cost, and the delivery outcome: completed before cutoff, late shipments, errors, exception resolution time. Keep the sample small but real, one channel or a defined set of SKUs rather than the whole catalog, and make sure exception orders are inside it, because a pilot that contains only clean single-item orders has tested the easy half of the operation and will flatter whichever option you prefer.

Write the two threshold lines before the pilot starts, not after the numbers arrive. Delivery at or above the current mode on your own metrics, and a full cost genuinely lower, including the supervision, training, and management hours the new option adds. Miss either line and the answer is to return to the diagnosis, change the option or the scope, and not to scale because the quote was attractive. Meet both and scale one step at a time, one channel or one shift, re-checking the same metrics after each step, because a pilot is evidence about a narrow slice of your operation, not a permanent verdict. If the candidate is to hand fulfillment to a 3PL, the pilot has its own rules, from a defined order set and a written SLA to the exit clause you test before you need it; see our guide to piloting a 3PL before you sign.

How to Act on the Result

With the diagnosis and the model in hand, the decision routes itself. If the bottleneck sits in Zone 2, carrier rate comparison, service selection, label generation, or multi-carrier operations, that is what shipping automation is for. A sensible way to start is a controlled pilot of EasyShippingX Portal on a set of real orders, run in parallel with your current flow, comparing labels, rates, and exception handling order by order. Only after the pilot flow is stable and you pass the volume threshold that justifies API integration should you move from the Portal to system-level integration. For how to design the multi-carrier operation behind Zone 2, see our guide to multi-carrier shipping strategy.

If the bottleneck sits in Zone 1, receiving, storage, or picking, shipping software will not repair it. Fix the warehouse process, the layout, or the WMS first, or move the physical operation to a 3PL. A shipping platform operates downstream of a picking process that works; it does not create one.

And if the model says outsource, negotiate like the model depends on it, because it does: written line items, real SLA terms, and an exit clause. The framework's job was to make the choice explicit. Your job is to re-run it whenever volume, parcel profile, or cost structure changes, because the answer has an expiration date.

Ready to run the numbers on your own operation?

EasyShippingX is a channel-neutral shipping layer: one consistent way to compare US domestic carrier options and execute through a portal, a spreadsheet, or an API. If your diagnosis points at carrier rate comparison, service selection, label generation, or multi-carrier operations, start with a controlled Portal pilot on real orders, and move to API integration once the flow is stable and you clear the volume threshold. See pricing or book a demo.

FAQ

There is no universal threshold, and that is exactly what the framework is for. In the example numbers (in-house at 7.70 per order plus 400 fixed, 3PL at 7.20 per order plus 600 minimums, automation at 5.30 per order plus 2,000 amortized), the 3PL wins between roughly 400 and 750 orders a month; with your own numbers the crossing points move. Run the three full-cost scenarios at Base, Peak, and Growth and apply the SLA guardrails, instead of chasing a magic number.
No. Automation replaces keystrokes in carrier portals, label generation, and rate shopping, which is Zone 2. Slow picking, disorganized storage, and bad pick paths live in Zone 1, whose remedies are labor, layout, a WMS, or a 3PL. Locate the zone before you pick the option, or the mismatch is guaranteed: a shipping platform operates downstream of a picking process that works, and it does not create one.
Yes. Industry averages are for decks, not for decisions: your parcel profile, labor market, demand shape, and error rate are not average. Every number in the framework is a placeholder for one you measure yourself. If you do not measure peak-hour volume, labor minutes per order, overtime and turnover cost, and error and rework rate accurately, the crossing points will lie to you.
Not necessarily. A 3PL converts fixed cost into variable cost, but it charges a pick-and-pack fee on every parcel, passes through postage, and layers on minimums and management cost. In the example numbers the 3PL only wins between 400 and 750 orders a month; above roughly 750, automation wins and the gap widens with volume, because its per-order cost is flat while the 3PL scales with every order.
If your diagnosis points at Zone 2, carrier rate comparison, service selection, label generation, or multi-carrier operations, start with a controlled EasyShippingX Portal pilot on real orders, then consider API integration once the flow is stable and you clear the volume threshold. If the bottleneck is receiving, storage, or picking in Zone 1, fix the warehouse process, WMS, or 3PL first; a shipping platform does not repair those steps by itself.
Only in two cases: you actually reduce paid hours or overtime, or the hours are redirected to work with a real schedule that produces revenue or removes risk. Otherwise they are slack, not a saving. And never count the same hour twice, once as a wage saving and again as the revenue produced in it.
Start with the option that actually changes the bottleneck, not the cheapest quote or the longest feature list. If orders pile up in picking and packing, test part-time labor or outsourced fulfillment. If hours go into re-entry, rate comparison, and label creation, fix the shipping workflow. If parcels are ready but not handed over, change the pickup schedule or the carrier mix. If several steps fail at once, stage the work and solve one constraint per stage, checking that each investment removed the bottleneck it was aimed at.