Ecommerce Brand Shipping Guide

Landed Cost vs. Delivered Cost: The True Per-Order Margin Formula for Ecommerce Brands

Most ecommerce brands run their P&L on a shortcut: revenue minus product cost minus "average shipping." It takes two minutes, it feels reasonable, and it is quietly wrong on every order. The problem is not the arithmetic. It is that two different numbers, landed cost and delivered cost, are being treated as one, and the shortcut computes neither of them correctly.

This article gives you the precise per-order margin formula, a line-by-line ledger template, a worked case where the same $59.99 SKU is fulfilled two different ways, a breakdown of the domestic parcel line into seven components you can actually attack, a hidden-cost checklist, and a decision framework for choosing the path that maximizes per-order profit. If you run finance, supply chain, or operations for an importing DTC brand selling on Shopify, Amazon, or Walmart, this is the model to bring to your next monthly review.

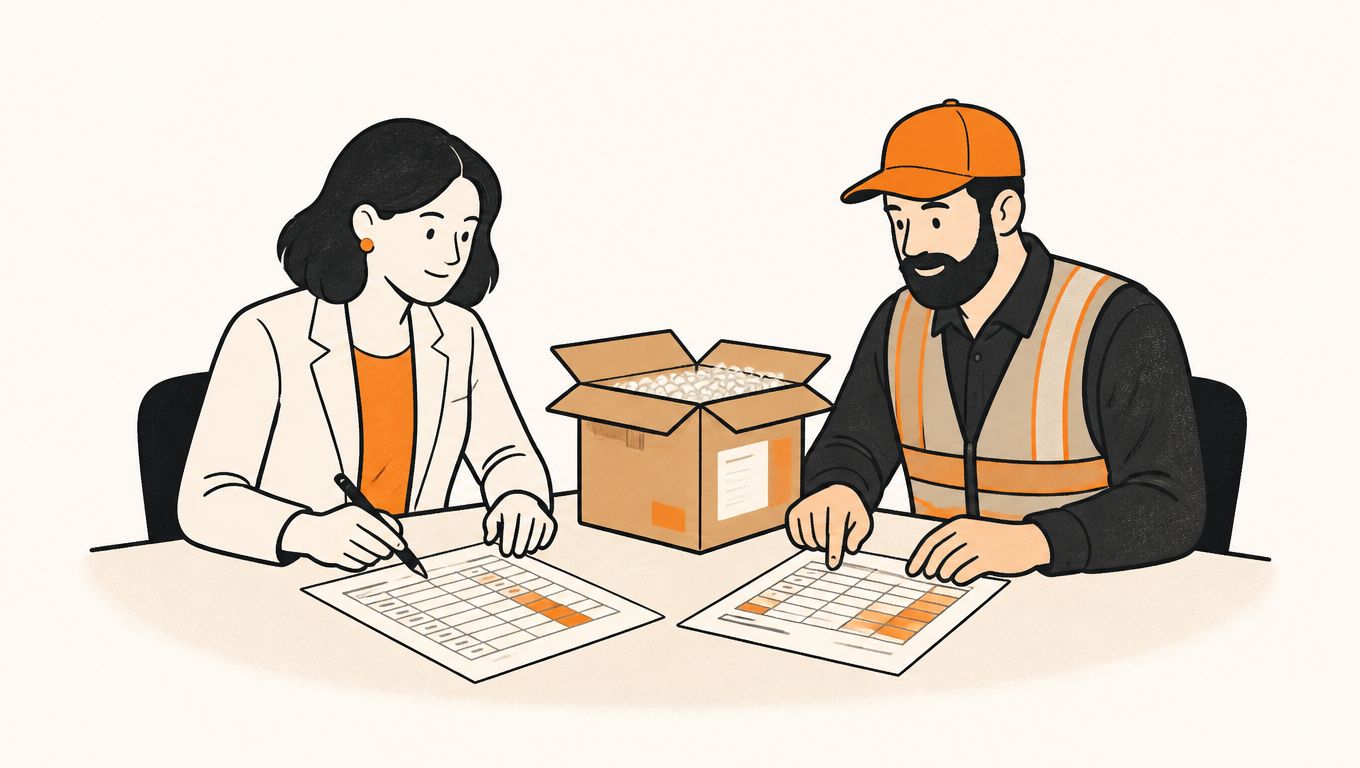
Finance lead and warehouse manager compare two cost ledgers beside an open labeled parcel.
Two numbers treated as one, wrong on every order

The Margin Gap Hiding in Your P&L

Landed cost is an inventory number. It is the full cost of getting a unit of product to your warehouse door, allocated to that unit: the purchase price at origin, ocean or air freight and insurance, duties and taxes on the customs value, customs clearance and brokerage, port and terminal handling, drayage to your warehouse, and a pro-rata share of storage and shrinkage while it sits in inventory. Some teams call it "true COGS" because it is the number that belongs on your balance sheet for inventory valuation and in your COGS line when the unit sells.

Connect the domestic parcel line to the operating levers in the shipping-cost optimization overview. Use the cost-per-successful-delivery method when checking how delivery failures change the margin calculation.

Delivered cost is an order number. It is the full cost of getting one order to the buyer's door: your allocated landed cost per unit, any international freight share for direct-to-consumer routes, the complete domestic parcel charge, and a share of failures, returns, and refunds attributed to that order. It is the number that belongs in your per-order P&L, because it is the cost you actually incur when the order happens.

Mix the two up and you will systematically overstate per-order margin, set ad budgets against a number that does not exist, and make sourcing and fulfillment decisions on the wrong side of reality. The relationship between them is simple: delivered cost per order equals allocated landed cost plus the fulfillment and last-mile components on top of it. Landed cost feeds inventory valuation and COGS. Delivered cost feeds per-order margin, ad budgets, and promotion decisions. A useful one-liner to keep on the finance wall: landed cost tells you what the product owes you, delivered cost tells you what the order costs you.
Landed Cost vs. Delivered Cost, Defined

Landed cost is an inventory number. It is the full cost of getting a unit to your warehouse door: purchase price, international freight and insurance, duties and taxes, clearance and brokerage, port and drayage, and a pro-rata share of storage and shrinkage. It is the number that belongs on your balance sheet for inventory valuation and in COGS.

Delivered cost is an order number. It is the full cost of getting one order to the buyer's door: allocated landed cost, any direct-to-consumer international freight share, the complete domestic parcel charge, and a share of failures, returns, and refunds. It is the number that belongs in your per-order P&L, because it is the cost you actually incur when the order happens.

The relationship is one line: delivered cost per order equals allocated landed cost plus the fulfillment and last-mile components on top of it. Landed cost feeds inventory valuation and COGS; delivered cost feeds per-order margin, ad budgets, and promotion decisions. Landed cost tells you what the product owes you; delivered cost tells you what the order costs you.
The True Per-Order Margin Formula

The formula that should drive every decision in the business is:

Per-order profit = Net revenue per order − Delivered cost per order − Variable selling cost per order

Net revenue per order is the list price after discounts and coupons, excluding marketplace fees and sales tax you collect and remit. Delivered cost per order is the allocated landed cost, plus any international freight share, plus the full domestic parcel cost with all seven components, plus the failure and return share. Variable selling cost per order is the marketplace commission, payment processing fees, attributable ad spend, and refund and chargeback reserve. Here is the ledger template, with where each row comes from:

RowWhat it isWhere the number comes from
Net revenue per orderList price after discounts and coupons, excluding fees and sales taxOrder report or marketplace settlement
Landed cost per unitPurchase + freight + duties/taxes/clearance + port/drayage + storage and shrinkageCustoms docs, freight invoices, warehouse reports
Domestic parcel per orderSeven components: package, zone, residential, surcharges, adjustments, failures, carrier mixCarrier invoices and shipment data
Delivered cost per orderLanded share + freight share + domestic parcel + failure and return shareSum of the rows above
Variable selling per orderCommission + payment processing + ads + refunds/chargebacksMarketplace settlements, processor, ad platform
Per-order profitNet revenue − delivered cost − variable sellingThe ledger

Build this ledger once, populate it monthly, and every decision downstream, sourcing, packaging, carrier routing, ad budget, discount depth, has a single source of truth.

Anatomy of the Domestic Parcel Line: Seven Components, Not One Average

Most P&Ls carry one line for domestic shipping: "shipping, average per order." That average hides seven separate cost drivers, and each one responds to a different lever. If you want the parcel line to shrink, you need to see the components.

  1. Package. Carriers bill on the greater of actual weight and dimensional (DIM) weight[1], so your box size sets a floor under every shipment. As an example, a 12 x 9 x 4 inch box weighs 2.2 lb but bills closer to 4 lb at FedEx/UPS divisors. Oversized packaging quietly converts cheap parcels into expensive ones.
  2. Zone. Distance is priced in zones, and the same parcel can cost 2 to 3 times as much to a distant zone as to a nearby one[8]. A zone-blended average obscures which of your customers live in expensive zones.
  3. Residential address. Residential surcharges and rural or remote delivery fees sit on top of the base rate[2]. If most of your buyers are households (they are), this is a permanent add-on, not an exception.
  4. Surcharges. Fuel, large parcel, oversized, overweight, signature, address correction. These are line items on every carrier invoice, and they compound on the base rate.
  5. Adjustments. Re-weigh and DIM audits apply corrections retroactively. What you were quoted and what you are invoiced can differ, and the difference lands as a surprise on the monthly bill.
  6. Failure cost. Failed delivery attempts, re-delivery, return to sender, and DOA or theft claims. Every failed parcel costs you the delivery attempt plus the retry or recovery.
  7. Carrier mix. The same parcel is priced differently by every carrier and service level. No single carrier wins every weight x zone x service cell, so the carrier you route with by default is, by definition, overpriced on some share of your volume.

Each component has a lever attached to it:

LeverHow it worksComponents it attacks
Packaging designRight-size boxes, compressible and DIM-safe packaging, lighter materials1 (DIM), 3 (oversize thresholds), 4
USPS commercial and cubic ratesCommercial Base/Plus and cubic pricing cut the per-parcel rate on small dense parcels[4]1, 2, 7
Regional carriersZone-local delivery networks price below national carriers on short zones2, 7
Multi-carrier routingPer-parcel selection of the cheapest carrier by weight x zone x service7, and feeds back into all

Multi-carrier routing is the only lever that spans every component, because it changes which carrier, and therefore which rate table, each parcel is priced against. That is the layer a channel-neutral shipping platform like EasyShippingX operates on: it compares US domestic carrier options on the same weight x zone x service cells and executes the best match through a portal, spreadsheet, or API, without being tied to any single carrier's price list.

Worked Case: One Product, Two Fulfillment Paths

Take one example SKU: a $59.99 product, about 1 kg, sourced from China, sold on Shopify, Amazon, and Walmart. Same product, same list price, same buyers. Two fulfillment paths, and the per-order profit differs by more than the marketing team's margin assumptions. All figures below are illustrative; replace them with your own data and run the ledger.

Path A: FOB + ocean freight + US fulfillment center + multi-carrier last mile.

LineAmount
Net revenue per order (after 5% average discount)$57.00
Purchase price (FOB, China)$9.50
Ocean freight and insurance$0.60
Duty (5%) and clearance$0.65
Port, drayage, inbound to fulfillment center$0.25
Storage and shrinkage share$0.20
Landed cost per unit$11.20
Base parcel rate (3 lb, zone-blended, commercial)$7.00
Residential and rural add-on$1.10
Fuel surcharge$0.60
Other surcharges (large parcel, signature, amortized)$0.30
Adjustments (re-weigh, DIM audit)$0.20
Failure cost (re-delivery, RTS, claims)$0.40
Multi-carrier routing savings($0.80)
Domestic parcel per order$8.80
Delivered cost per order$20.00
Marketplace commission (blended 12%)$6.84
Payment processing (2.9% + $0.30)$1.95
Attributable ad spend$4.00
Refund and chargeback reserve (2% of orders x $63)$1.26
Variable selling per order$14.05
Per-order profit$22.95
Margin on net revenue40.3%

Path B: DDP air freight, delivered door to door, no US inventory.

LineAmount
Net revenue per order (after 5% average discount)$57.00
Purchase price$9.50
DDP door-to-door freight (air, duty, clearance, last mile)$9.50
Failure and cross-border RTO reserve$1.50
Delivered cost per order$20.50
Marketplace commission (blended 12%)$6.84
Payment processing (2.9% + $0.30)$1.95
Attributable ad spend (slower delivery, no Prime badge)$5.50
Refund reserve (5% of orders x $67)$3.35
Variable selling per order$17.64
Per-order profit$18.86
Margin on net revenue33.1%
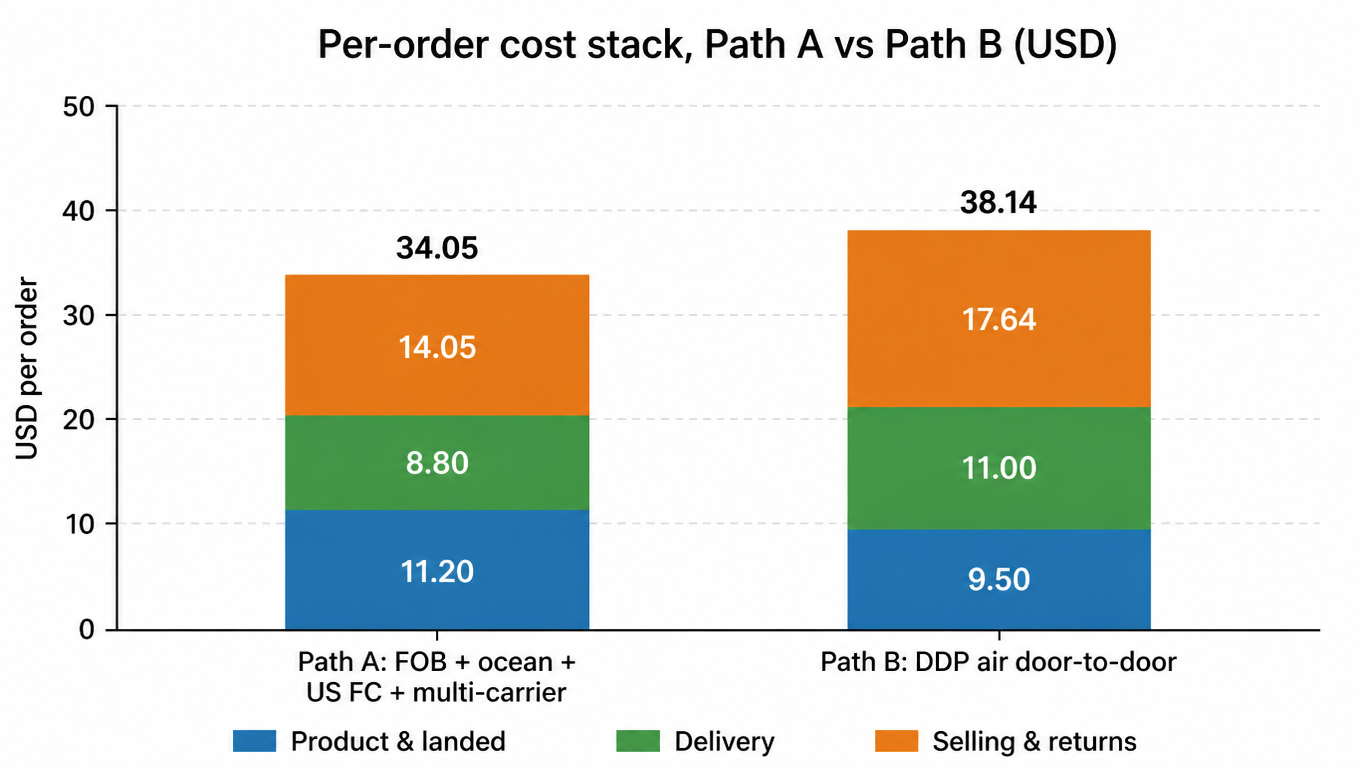
Stacked bar chart: per-order cost stack for Path A vs Path B (USD), product and landed, delivery, selling and returns
Per-order cost stack, Path A vs Path B (USD)

Path A clears $22.95 per order, Path B clears $18.86. The same product, the same buyers, a $4.09 difference per order, about 22% more profit. On 10,000 orders a month that is roughly $41,000 a month, or close to $490,000 a year, in margin that does not exist under Path B. And notice where the gap comes from: not the purchase price, which is identical, but the failure and return economics of cross-border direct delivery, the marketing cost of a slower promise without a Prime badge, and the parcel line, which Path A actively compresses with packaging, commercial rates, and multi-carrier routing.

Now check the shortcut P&L for this example. Most brands would compute $57.00 minus $9.50 product minus a $7.00 "average shipping" line, call it $40.50 gross margin, subtract a loose $10 for "fees and ads," and conclude they clear about $30 per order. The ledger says $22.95 on the better path. The shortcut overstates margin by roughly 25%, and a finance team that sets ad budgets or discount depth against that phantom $30 is making decisions on a number that never existed.

What actually decides the winner between the paths is three things: weight, because air freight scales with kilograms while ocean scales with volume; value density, because freight that is small relative to the product's value can ride either path; and how fast the brand needs stock in market, because ocean locks capital in transit for weeks while DDP air keeps the cash conversion short. Run your own SKU through the ledger, not through intuition.

The Hidden Cost Checklist, Beyond the Parcel Line

The parcel line is where most teams start, and it is where this article has spent its energy so far, but the full delivered cost has landmines outside it. Audit your books for these:

  • HTS classification and customs value errors. A wrong HS code or an understated customs value invites a customs audit, back duties, and penalties[7]. The classification is decided at origin, but the risk lands on your margin years later.
  • DDP vs DAP risk transfer. Under DAP, the buyer owns the risk at the destination; under DDP you own it until delivery[5]. Door-to-door quotes can look cheap until you read which party owns returns, refusals, and DOA. Ask the question before you sign, not after the first DOA batch.
  • Reverse logistics and cross-border RTO. A returned order can cost 2 to 3 times the outbound delivery: refunded revenue, lost shipping, and for cross-border, a return to sender that costs more than the item, so most brands abandon it and eat the loss[3]. This is why the refund reserve line in Path B is more than double Path A's.
  • FX and cash in transit. Ocean freight turns cash into inventory for weeks. If you pay suppliers in CNY and price in USD, the exchange rate between order and arrival is a real cost line, even if it never appears on an invoice.
  • Warehouse storage and shrinkage. Storage is billed per pallet or per cubic foot per month, and overage fees punish slow movers. Shrinkage, damage, and expiry eat units that never sell.
  • Marketplace commission structure and true net revenue. Amazon and Walmart referrals are a percentage of the sale[6], calculated on the price the buyer actually pays, which means aggressive discounts cut net revenue dollar for dollar while the fee percentage stays fixed. Model the commission on the discounted price, not the list price.

Decision Framework: Which Path, Which Lens

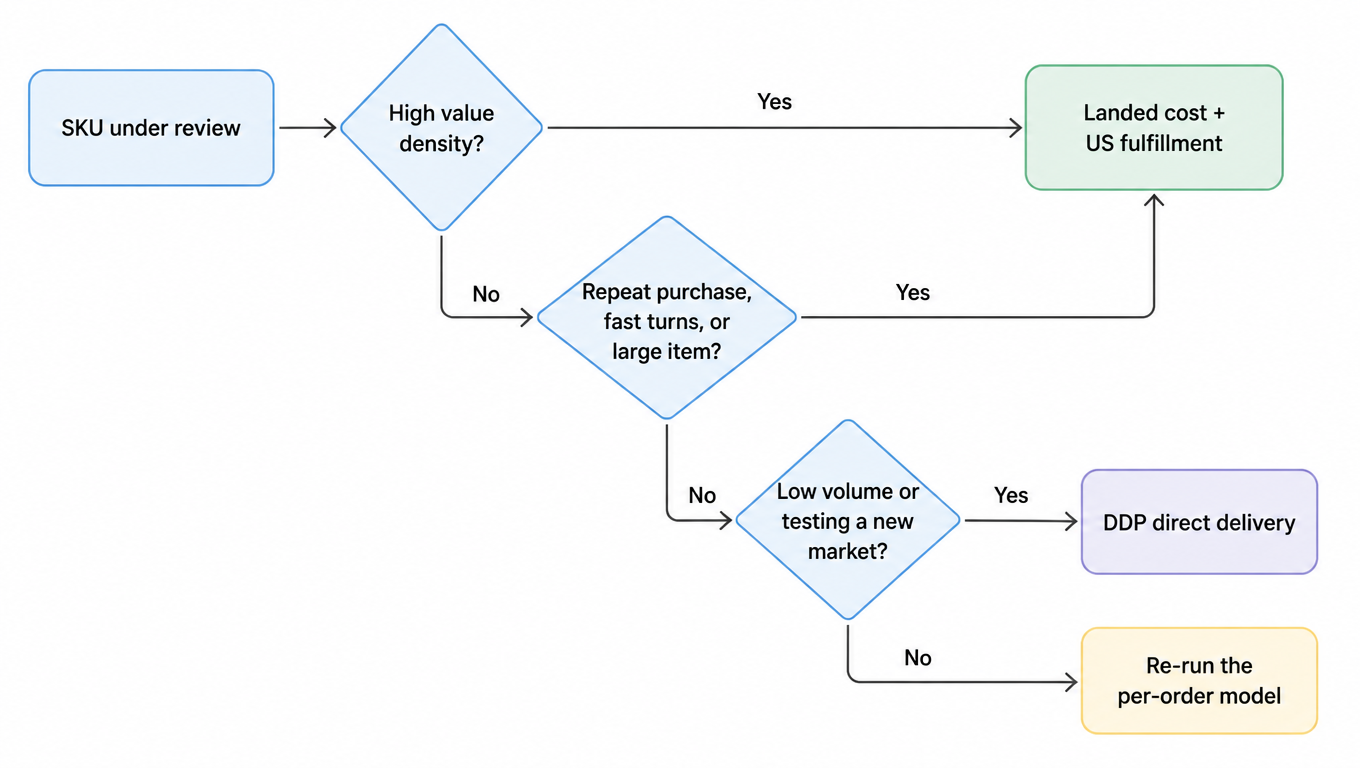
Use landed cost plus a US fulfillment center when the value density is high, the item is large, repeat purchase matters, or turns are fast. Use DDP direct delivery when the item is light and small, volumes are low, or you are testing a new market. The decision flow below is the starting heuristic; the per-order model is the arbiter.

Decision tree: SKU under review, high value density to landed cost plus US fulfillment; else repeat purchase, fast turns, or large item to landed cost plus US fulfillment; else low volume or testing a new market to DDP direct delivery; else re-run the per-order model
The heuristic points the way, the model arbitrates

The one nuance the flow compresses: a high-value, small, low-volume item can justify DDP air even at high value density, because freight stays small relative to value and you avoid a warehouse contract entirely. Run it through the model either way, and run sensitivity on the three variables that moved the case above: weight, value, and order velocity.

Once the goods are in the United States, the last mile stops being an international problem and becomes a pure carrier-selection problem. Compare US domestic carriers on the same weight x zone x service cells, choose per parcel rather than per contract, and let the parcel line shrink component by component. Run your own shipment profile through the shipping rate calculator first, then see how much multi-carrier routing can carve out. A channel-neutral layer that compares and executes across carriers, through a portal, spreadsheet, or API, is what turns the seven-component anatomy into a working optimization loop instead of a quarterly argument with one account rep.

Building the Model into Your Finance Workflow

A formula only pays rent if it shows up in the monthly routine. Three pieces make it stick:

First, a monthly landed cost accrual. One row per SKU, one column per cost component: purchase, freight, duties and taxes, clearance, port and drayage, storage and shrinkage. Sum to a landed cost per unit that feeds COGS and inventory valuation, and flag any SKU whose landed cost moved more than a threshold versus last month.

Second, delivered cost tracking by carrier, zone, and product category. The parcel line is not one number; it is seven, and they move independently. Track base rate, residential add-on, fuel, surcharges, adjustments, failures, and carrier mix by zone, and you will see the pattern that a blended average hides, for example, which zones are structurally unprofitable at your current pricing.

Third, an explicit trigger list for recalculation. Rebuild the model when duty rates change, when freight rates change, when packaging changes, when a carrier changes its surcharge structure, or when the exchange rate moves materially. Put the trigger list next to the model, not in someone's inbox.

Finally, divide ownership. Finance owns the ledger and the landed cost accrual. Operations owns the parcel data and the carrier routing. A monthly review, thirty minutes, walks the delivered cost per order by category and zone against the plan. That cadence is what turns this article from reading into a working margin system, and it is the difference between a brand that knows its per-order profit and a brand that guesses it.

Ledger built? Ready to attack the parcel line?

EasyShippingX is a channel-neutral shipping layer: one consistent way to compare US domestic carrier options and execute through a portal, a spreadsheet, or an API. Comparing USPS discounted rates, regional carriers, and executable multi-carrier paths for your own weight x zone x service profile is exactly the step that turns the parcel line from "average shipping" into seven components you can compress one by one. See pricing or book a multi-carrier workflow demo.

FAQ

Landed cost is an inventory number: the full cost of getting a unit to your warehouse door, including purchase price, international freight and insurance, duties and taxes, clearance, port and drayage, and a share of storage and shrinkage. Delivered cost is an order number: your allocated landed cost per unit plus the full domestic parcel charge and a share of failures, returns, and refunds. Landed cost feeds inventory valuation and COGS; delivered cost feeds per-order margin, ad budgets, and promotion decisions.
Per-order profit = net revenue per order − delivered cost per order − variable selling cost per order. Net revenue is the discounted price you actually receive; delivered cost is the allocated landed cost plus the complete domestic parcel charge with all seven components plus the failure and return share; variable selling cost is marketplace commission, payment processing, attributable ads, and refunds and chargebacks. Build this ledger once, populate it monthly, and every sourcing, packaging, routing, and ad decision has one source of truth.
Because the domestic parcel line is seven components, not one number: package (DIM weight), zone, residential address, surcharges, retroactive adjustments, failure cost, and carrier mix. A blended average hides which zones are structurally expensive, which parcels are paying for their own oversized packaging, and which share of volume could move to a cheaper carrier. Each component responds to a different lever: packaging design, USPS commercial and cubic rates, regional carriers, and multi-carrier routing.
Use landed cost plus a US fulfillment center when value density is high, the item is large, repeat purchase matters, or turns are fast; use DDP direct delivery when the item is light and small, volumes are low, or you are testing a new market. The heuristic points the way, the per-order model arbitrates: run your own SKU through the ledger with weight, value, and order velocity sensitivity, and pick the path with the higher per-order profit.
HTS classification and customs value errors that invite audits and penalties, DDP vs DAP risk transfer (who owns returns, refusals, and DOA), reverse logistics and cross-border return-to-sender, FX and cash in transit, warehouse storage and shrinkage, and marketplace commission structure calculated on the discounted price rather than list price. As an example, a returned order can cost 2 to 3 times the outbound delivery.