Last-Mile Delivery · Own Fleet vs. Parcel Carrier Cost Framework

Own Delivery Fleet vs. Parcel Carriers: A Cost Framework for Ecommerce Orders

Every few quarters, a DTC founder looks at the carrier invoice, sees the fuel surcharge line grow again, and asks the same question: what if we just delivered the orders ourselves? The honest answer is rarely "never" and almost never "everywhere." It is a per-zone, per-service-tier question that most sellers never actually do the math on, because the math looks intimidating: vehicle leases, commercial auto insurance, driver wages, routing software, idle time. This guide gives you the framework that math runs on, plus a worked example you can copy your own numbers into.

The scope matters up front. This framework is written for national shippers whose default network is UPS, USPS, FedEx, and regional carriers, and who are toying with one specific idea: running a small owned fleet for the last few miles inside a dense metro core, as a same-day pilot. Not a nationwide private fleet. Once you frame it that way, the decision becomes tractable: you are comparing one delivery zone against one carrier service tier, and the winner determines a pilot, not a strategy. EasyShippingX is a channel-neutral shipping layer that compares US domestic carrier options and executes through Portal, Excel, or API; here it is the tool that gets the honest carrier baseline right.

Small delivery van beside a neat stack of parcels on a city street at dusk.
Owning a van is not the same as owning a network: this is a math problem, not a passion problem

1. Why "Build Our Own Fleet?" Keeps Coming Up

The trigger is usually a combination of three pressures. First, customer expectations have moved: same-day is no longer a luxury promise from Amazon, it is a question customers ask smaller brands too, with a large share of younger buyers treating it as a precondition of orderingeCommerce Delivery Statistics (Capital One Shopping). National carriers do offer same-day-grade products, but they are priced at a premium and available only in select metros, which makes the carrier option look expensive exactly where your customers are most concentratedFedEx SameDay: What's Still Available + Alternatives (Dropoff).

Keep fleet and carrier costs within the same scope defined in the shipping-cost optimization overview. Compare the completed-delivery outcome with the cost-per-successful-delivery method rather than comparing only a route wage with a label price.

Second, the per-package economics of network carriers keep eroding. Fuel surcharges, residential delivery fees, dimensional weight adjustments, and seasonal peak surcharges stack on top of the base rate, so the number on your rate sheet is rarely the number on your invoiceUPS and FedEx 2026 Rate Increases (3PL Center). For a brand shipping 1 to 2 lb parcels to residential addresses, the all-in cost is routinely 40% to 80% above the base rate, and it drifts upward every peak season.

Third, and often decisive, is service control. Failed delivery attempts, damage claims, and the anonymous driver experience all feel outside your control when the last mile belongs to someone else's network. A driver in your own van, with your own scanner and your own uniform, changes the returns experience and the unboxing story in ways that are hard to price but easy to feel.

The mistake is to let these pressures turn into a company-wide build decision. Same-day demand is geographically concentrated, typically inside a handful of dense ZIP clusters. Your cost structure for those zones is completely different from your cost structure for a rural zone 7 delivery. Frame the decision as zone by zone, tier by tier, and most of the fear and most of the hype both dissolve.
2. Baseline First: What a Parcel Carrier Package Actually Costs

Before you cost an owned route, you need an honest baseline for the carrier option, and most sellers misprice it. The true cost of a parcel carrier delivery is a stack, not a single number: base rate plus fuel surcharge plus residential delivery fee plus dimensional weight adjustment plus zone distance plus peak surcharges plus accessorials such as address correction, reattempts, and oversized handling. The base rate is the smallest and most misleading part of the stack. For the full line-by-line anatomy of that stack, see our breakdown of the true cost of last-mile delivery.

Two realities shape the comparison for a metro core pilot. First, same-day-grade service through national networks is rarely available at ordinary DTC rates. The expedited, local, same-day products that do exist are built for high-value, low-volume use cases and priced accordingly, often $15 to $30 per package. Second, the service those core-zone orders would otherwise receive is standard ground: two-day-or-so delivery at a negotiated rate. That is the realistic baseline for most of the volume, and it is what you should compare against unless you are prepared to charge your customers for true same-day speed from a network carrier.

So the baseline question is: what does one ground package, 1 to 2 lb, residential, in a metro zone 2 to 5, actually cost all in? For a typical mid-size DTC shipper, the honest range is $6 to $9 per package depending on volume, zone mix, and negotiation. Use the middle of that range, about $7.50, as your working number, and remember it is an all-in figure, not a base rate. If you have been quoting your carrier option from the base rate on your rate sheet, you have been understating the incumbent by a wide margin, which quietly flatters the fleet case. Fix the baseline first, then run the fleet math.

3. The Full Cost of an Owned Route (The Framework)

An owned route has three cost layers, and the discipline of the framework is that you name every layer before you compare anything.

Fixed costs exist whether you deliver 10 stops or 100. Vehicles, leased or financed, plus commercial auto insurance, which is meaningfully more expensive for delivery use than for a personal vehicle, plus cargo insurance for the parcels inside the van. Then the quieter fixed items: permits and parking in a dense downtown market, phones and scanners, and the routing and dispatch software that turns 300 addresses into 4 driveable routes. Fixed costs only become per-stop numbers when you divide by actual stops, which is why utilization dominates everything.

Variable costs scale with each stop. Driver wages plus payroll taxes, benefits, and workers' compensation, which for delivery driving is a real line item. Fuel or charging per route. Maintenance and tires, which accrue faster on stop-and-go urban routes than on highway miles. Tolls and congestion fees where they apply. As a rule of thumb, the variable layer is small, often $0.30 to $0.70 per stop; the fixed layer is where fleets are won or lost.

Hidden costs are the layer that sinks most pilots. Idle time when dispatch is waiting on orders. Reattempts when nobody answers, which an owned fleet absorbs fully instead of sharing with a network. Supervisor and dispatch overhead that someone has to pay even when the operation runs well. Seasonal under-utilization, because a fleet sized for November sits idle in February while a carrier network just stops billing you. And compliance: hours tracking, vehicle maintenance logs, and insurance audits are not free.

The output of the framework is one number: cost per stop, equal to the amortized fixed pool over expected stops plus variable cost per stop. Everything that follows, in the worked example and the sensitivity levers, is just this formula being honest about its inputs.

4. Worked Example: 300 Orders Per Day in a 10-Mile Core Zone

Now the concrete case. A DTC brand ships about 300 orders per day from a single hub into a dense metro core, roughly a 10-mile radius covering a cluster of ZIP codes. Today those orders go ground via a national carrier at the $7.50 all-in baseline. The brand wants to test an owned fleet for same-day delivery inside that zone for 60 to 90 days. Should it?

Assume 22 operating days per month, so 300 stops per day is about 6,600 stops a month. At urban density, a well-routed delivery driver can complete roughly 75 stops in an 8-hour shift, which is a planning number, not a hero number. That means 4 routes cover the volume, so the pilot needs 4 full-time drivers plus 1 spare vehicle for breakdowns and maintenance days: 5 vans on the books.

Build the monthly fixed pool. Four drivers at a loaded cost of about $4,300 per month each, meaning wage plus taxes, benefits, and workers' comp, with the US median wage for delivery drivers as a sanity anchorDelivery Truck Drivers (US Bureau of Labor Statistics), comes to $17,200. Five vehicles at $1,200 per month each, covering lease or financing, commercial auto and cargo insurance, permits, and parking, comes to $6,000. Overhead for routing software, part-time dispatch and supervision, and compliance runs about $2,500. The fixed pool is $25,700 per month.

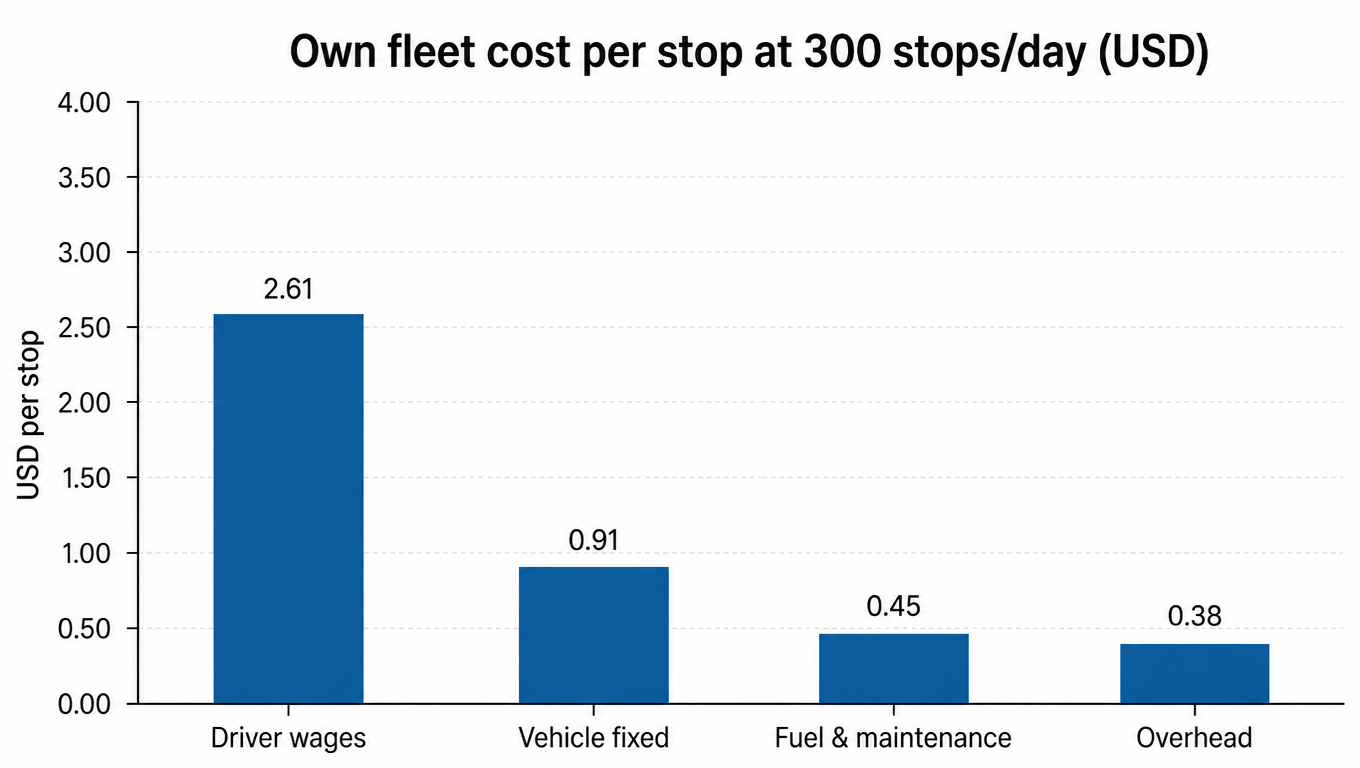
Spread that pool over the 6,600 stops and add the variable layer. Fixed cost lands at about $3.89 per stop, roughly $2.61 in driver time, $0.91 in vehicles, and $0.38 in overhead. Variable fuel, maintenance, and tolls add about $0.45 per stop. Total own-fleet cost: about $4.35 per stop.

Bar chart: own fleet cost per stop at 300 stops per day, driver wages 2.61, vehicle fixed 0.91, fuel and maintenance 0.45, overhead 0.38, about 4.35 USD total
Own fleet cost per stop at 300 stops/day (USD)

Against the $7.50 carrier baseline, the fleet saves roughly $3.15 per stop, about $20,800 per month at full volume, more than a quarter of a million dollars a year on this one zone. That is a genuinely attractive number, and it is exactly why you should be suspicious of it. The whole result rests on two assumptions: density high enough for 75 stops per route, and volume steady enough to run 4 routes every operating day. Nudge either one and the verdict moves fast, which is the subject of the next section. The verdict at full utilization is that the fleet wins on pure cost per stop, but the margin of victory is a utilization story, not a rate-sheet story.

5. What Actually Moves the Math (Sensitivity Levers)

Three levers decide whether the worked example survives contact with reality, and you should stress-test all three before signing a lease.

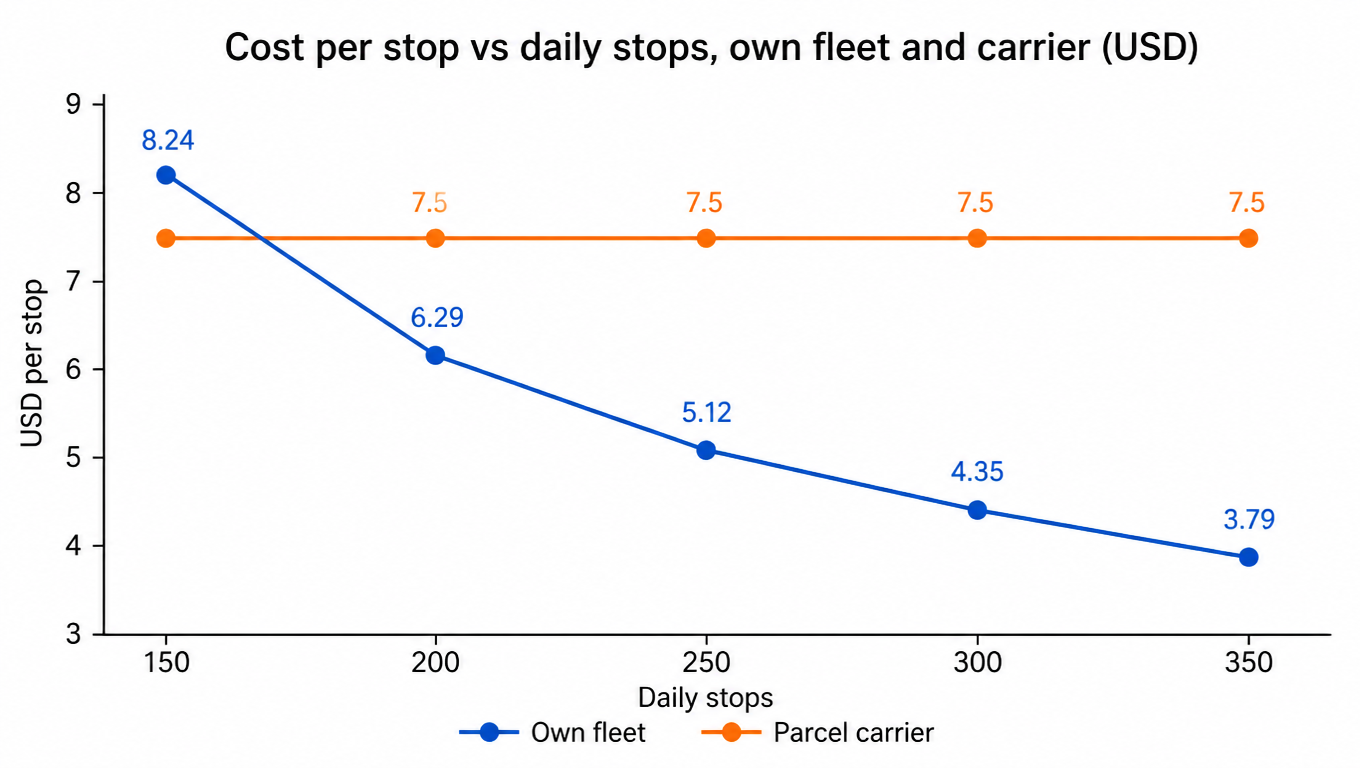
The first is utilization, meaning actual stops divided by planned stops. The fixed pool does not shrink when volume dips, so cost per stop climbs steeply as daily volume falls. At 300 stops per day the fleet costs about $4.35 per stop. At 250 it is about $5.12. At 200 it is about $6.29. At 150 it crosses above the carrier baseline to roughly $8.24, and the fleet now loses money on every stop while also carrying all the operational risk. Using the formula, the break-even against the $7.50 baseline lands around 165 stops per day, which means a pilot that averages below about 165 stops in the zone is burning cash versus the carrier, no matter how good the customer feedback is.

Line chart: cost per stop vs daily stops, own fleet 8.24 at 150, 6.29 at 200, 5.12 at 250, 4.35 at 300, 3.79 at 350; parcel carrier baseline flat at 7.5 USD
Cost per stop vs daily stops, own fleet and carrier (USD)

The second lever is seasonality, and it cuts against the fleet twice. In the trough months, your own vans sit idle while the carrier only bills you for what you ship, which is the whole advantage of a variable-cost network. In the peak, carrier surcharges climb, which flatters the fleet, but a fleet sized for peak volume is radically overbuilt the other eleven months. The sane design is to size the fleet for the shoulder season and let the carrier absorb peak overflow, which is exactly what a hybrid setup does.

The third lever is failed attempts and returns. A network carrier spreads reattempt costs across its whole system and its negotiated contract; your fleet eats every reattempt as a full stop with no extra revenue. If your core zone is apartments with front-door access problems, add 5% to 10% to the per-stop cost before you compare. And returns flow both directions: an owned fleet can make pickup-and-swap deliveries dramatically cheaper than a carrier's return labels, which is a real benefit, but only if you actually design the return flow into the routes.

6. Designing the Pilot So It Can Fail Cheaply

The point of a pilot is to learn whether the fleet math holds in your real demand pattern, which means it must be designed so that a negative answer costs little and a positive answer scales cleanly. Start with zone selection. Pick ZIP clusters, not a circle on a map: you want contiguous, high-density census blocks within a short drive of your hub, with a stop density of several deliveries per street block. A 60 to 90 day window is long enough to see two full demand cycles and short enough to keep the capital exposure small, and lease vehicles rather than buying them so the exit is cheap.

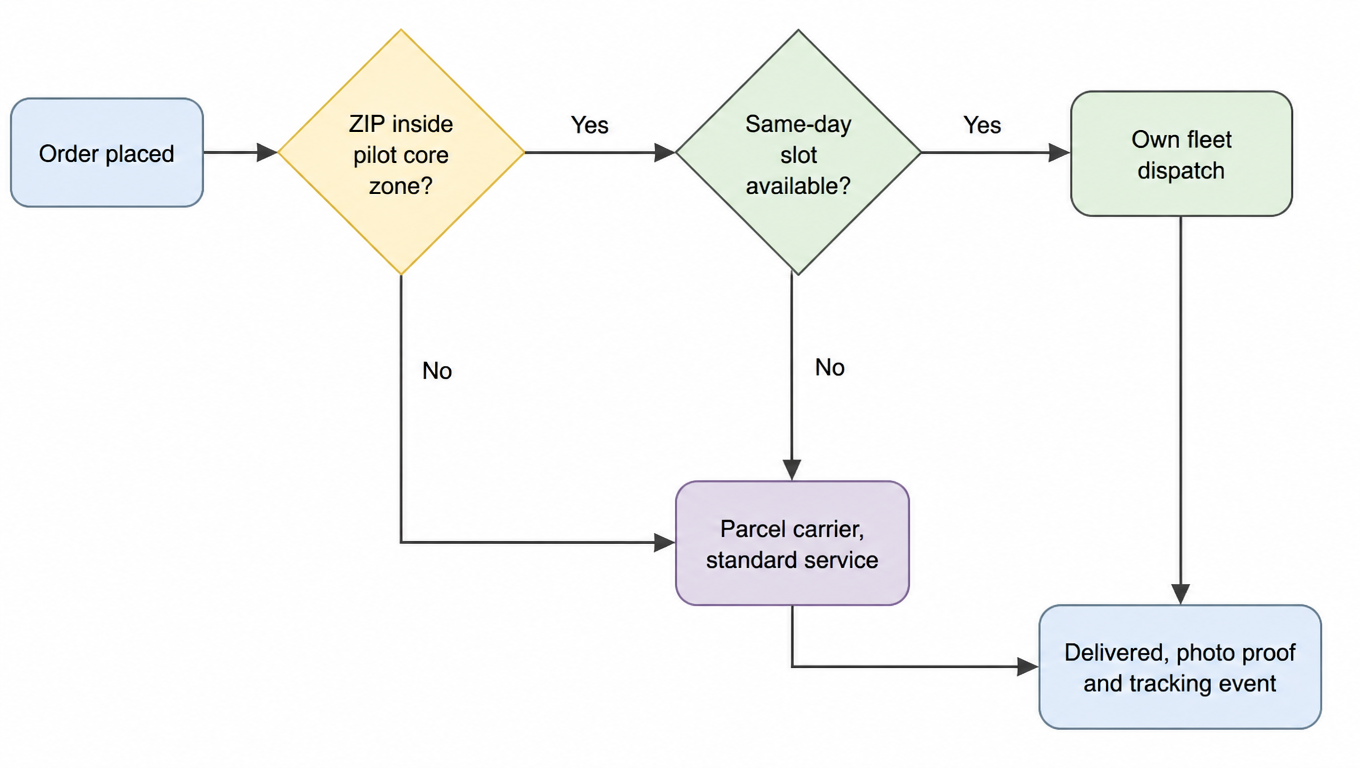
Execution should be hybrid from day one. Owned fleet inside the core zone, network carriers everywhere else, with a clear rule for which order goes which way. A useful decision flow: an order enters the system, and if the destination ZIP is inside the pilot zone and a same-day slot is available, it dispatches to the owned route; otherwise it flows to the parcel carrier as it always has. That fallback is your safety valve, and it means a bad day in the fleet never becomes a bad day for the customer. It is also the same instinct as matching each parcel to the right carrier, which the multi-carrier shipping strategy guide develops end to end.

Decision flow: order placed, is destination ZIP inside the pilot core zone, if yes is a same-day slot available, if yes own fleet dispatch then delivered with photo proof and tracking event, otherwise parcel carrier standard service
Hybrid dispatch decision flow: own fleet in the core, carrier everywhere else as the fallback

Customer experience has to stay consistent across both paths. Same tracking page, same delivery notifications, same branding on the final doorstep, so that the pilot is testing operations, not confusing customers. And segment honestly at checkout: if you advertise same-day only for the core zone, say so plainly, because promising it and failing is worse than not offering it.

Finally, define the go/no-go gates before you start, and pre-commit to them. The three numbers that matter are cost per stop against the carrier baseline, on-time delivery percentage, and the reattempt rate, which is where service control claims live or die. A reasonable gate: cost per stop below the carrier baseline at your real average daily volume, on-time above 95%, and reattempts under 5%, sustained for four consecutive weeks. If the fleet clears those, you have earned the right to scale zone by zone. If it does not, you have spent maybe a quarter's worth of lease payments to learn something your P&L would otherwise have learned the expensive way.

7. When the Answer Is No

The framework produces a clean no more often than sellers expect, and the signs are visible early. Sprawl is the first: if your core zone is really 25 miles of suburbia with 2 stops per street, the 75-stops-per-route assumption collapses and the fleet case dies with it. Low density is the same disease at a smaller scale: apartment buildings and office towers are your friend, single-family cul-de-sacs are not. Weekend spikes punish a fixed fleet, because Monday-through-Friday utilization math does not pay for Saturday surges or Sunday idleness. Capital constraints matter too: if the upfront vehicle and insurance commitments would stress the working capital line that buys inventory before peak, the fleet is a bad trade even at a positive per-stop number. And thin margins are the ultimate filter: a fleet that saves $3 per stop only matters if you keep the savings, not if it forces your cash into vehicles instead of growth.

When the math says no, there are cheaper middle paths that capture part of the same-day value without the fixed-cost bet. Local courier networks and same-day aggregator platforms give you same-day capability in dense metros on a per-delivery basis, no vehicles, no insurance pool, no idle time, at a price between ground and a national expedited product; regional carriers are usually cheaper than the national networks on short zones, and the when a regional carrier saves money guide shows exactly when to switch and when not to. Zone skipping with regional carriers attacks the same problem from the other side, cutting the network miles and the zone charge for your metro-heavy volume. Run the same framework against those options, same baseline, same utilization honesty, and let the winner be the one that survives the sensitivity levers, not the one that sounds best in a strategy meeting. For a fuller map of who delivers what in the US last mile, see our US last-mile carrier landscape analysis.

None of this says fleets are always wrong. In a dense core with steady volume, the worked example is real: $4.35 against a $7.50 baseline is a durable edge worth building a pilot around. What the framework says is that the edge is earned at the margin, by density and utilization, and it is measured per zone against an honest all-in carrier baseline. Do the math on the zone you actually have, run the pilot small, and let the data decide whether the van in your driveway should also be on your customers' streets.

Sources

The $4,300 loaded driver cost, 75 stops per route, and $1,200 monthly vehicle cost in the worked example are internal example inputs that demonstrate the framework; replace them with your own contracted rates and operating numbers before deciding.

FAQ

When two conditions hold at once: your volume is concentrated in one high-density core zone, and daily stop count is steady. In the worked example, 300 stops a day in a 10-mile core runs about $4.35 per stop on an owned fleet against a $7.50 all-in carrier baseline, with break-even near 165 stops a day. Below that, at lower density, or with volatile volume, the fleet loses money on every stop.
Cost per stop equals the amortized fixed pool divided by expected stops, plus variable cost per stop. The fixed pool covers vehicle lease or financing, commercial auto and cargo insurance, permits and parking, and routing and dispatch software; variable cost covers driver wages, fuel or charging, maintenance, and tolls. Do not forget the hidden layer: idle time, reattempts, supervision and dispatch, seasonal under-utilization, and compliance. The bigger the fixed pool, the more utilization decides everything.
It depends on your fixed pool and carrier baseline, but in a typical metro core scenario it lands around 165 stops a day. In the worked example, 300 stops a day costs about $4.35 per stop, 250 about $5.12, 200 about $6.29, and 150 about $8.24, already above the $7.50 carrier baseline. Plug in your own fixed costs and all-in carrier price to find your own tipping point.
Yes, and it is the only way an owned fleet is worth taking seriously. Pick one dense ZIP cluster for a 60 to 90 day pilot, lease rather than buy, run your own fleet inside the core and parcel carriers everywhere else, with a rule that dispatches to the fleet only when the ZIP is in-zone and a same-day slot is free. Set gates up front: cost per stop below the carrier baseline, on-time above 95%, reattempts under 5%, sustained for four weeks, before scaling zone by zone.
Do not force the fixed cost. Take a middle path: local courier networks and same-day aggregator platforms sell same-day capability in dense metros per delivery with no vehicles or insurance pool, and regional carriers are usually cheaper on short zones, where zone skipping can cut network miles and zone charges. Run the same framework and the same honest baseline against those options, and let the one that passes the sensitivity levers win.