Returns & Shipping Audit

Are Shipping Problems Driving Your Returns? A Root-Cause Audit for DTC Brands and 3PLs

When damaged, late, and wrong item all rise in the same quarter, operations, the warehouse, and the carrier each offer a different explanation, and the brand has already paid the refund, the replacement, and the handling cost. This guide answers one question: before you change carriers or add packaging cost, what evidence do you actually need. The method is a five-step audit that confirms the counting rules, attaches physical evidence, compares like-for-like orders, chooses an action, and validates it on a small sample.

Editorial illustration of a returns bench at the end of a warehouse shift, with a crushed carton, a tablet showing three rising bars, and a worker checking a packing slip.
One report, three teams, three conclusions

1. The Returns Report Is Climbing, and Nobody Knows Where the Next Dollar Goes

When the reason codes for damaged, late, and wrong item all move up in the same quarter, three teams read the same report and reach three different conclusions. Operations points at the warehouse floor, the warehouse points at the carrier, and the carrier points at a change in what customers expect from the last mile. Every story is plausible, and the report supports all of them, because a returns reason code was never designed to assign responsibility. It was designed to route a return.

The money is already moving no matter who is right. Reverse transportation, receiving and inspection labor, restocking or scrapping, replacements, and the refund itself stack up whether or not anyone agrees on the cause. The problem is not the size of the returns number. The problem is that the next improvement dollar has three or four plausible destinations and no evidence pointing at any one of them.

This guide answers one question: before you change carriers or add packaging cost, what evidence do you actually need? The method below is a five-step audit that turns a pile of reason codes into a short list of defensible actions, and it is explicit about the events that no action should be taken on yet.

One boundary up front. You will not find a benchmark of the form shipping causes a certain share of returns here, and you should be suspicious of the ones you do find. Published figures in that range come from different definitions, different observation windows, and different product mixes, and they are almost never reproducible inside your own order data. A number you can recompute next quarter beats a number you can only cite.

It also helps to place the audit in its wider setting. Returns are one stage of the ecommerce shipping chain that runs from checkout through fulfillment and delivery and back again: ecommerce shipping solutions.

2. Four Pairs of Numbers Teams Keep Mixing Up

The reason a customer selected versus the reason the evidence supports. Damaged on a return form is a customer's description of what they saw when they opened a box. It is a starting hypothesis, not a finding. It can be accurate, it can be a convenient option on a dropdown, and it can describe a preference the customer would rather not explain. Treat the field as a pointer to go look, never as a conclusion to act on.

Physical returns versus refunds, order edits, and cancellations. Shopify splits these into two metric families[1]. Sales reversals and reversed quantity count refunds, returns, order edits, and cancellations together, so that figure can rise with no box ever moving. Quantity returned and return line item reason count units physically sent back and record the reason line by line. If you diagnose a transport problem using the first family, you are partly measuring policy changes and customer service decisions. Use the second to establish that goods actually came back, and use the first to see the cost of the whole reversal.

Damage discovered at the returns dock versus damage that happened on the outbound leg. Discovery location is not occurrence location. A unit that arrived in good condition and comes back with a cracked housing was most likely damaged on the way back. A carton that looks fine but contains a broken internal part was most likely damaged on the way out, even though the box survived. Crediting a carrier for damage that happened in your own reverse leg, or blaming your pack spec for damage that happened on the return trip, are two of the most common attribution errors in this whole exercise.

A carrier's raw returns versus that carrier on comparable parcels. A carrier that moves your heavy, fragile, long-zone volume will look worse on raw returns than one that mostly moves padded envelopes a few zones away. That comparison tells you about your product mix, not about service quality. Comparable means matched on SKU fragility class, packaging version, origin and destination ZIP pairs, weight and dimension tier, and service level. Anything less is a mix effect wearing a performance costume.

It is worth noting that the underlying fields have gotten better, not worse. Return reasons are now available at a much finer grain, including product-category-specific lists where an apparel return can separate too large from too small instead of landing in a generic bucket[2]. More granularity helps you segment returns. It still does not tell you whether the cause was the pack, the pick, the carrier, or the customer. That judgment has to be made with evidence you assemble yourself.

3. The Audit in Five Steps, and the Step Where You Stop

The audit runs in a fixed order, and the order matters more than the individual steps. Each one produces an artifact the next one consumes, and each one has an explicit stop condition. Stopping is a legitimate outcome: it means the record is not good enough to justify spending money yet. If you are auditing a single failed order instead of a quarter of them, the companion method is the shipping problem diagnostic framework.

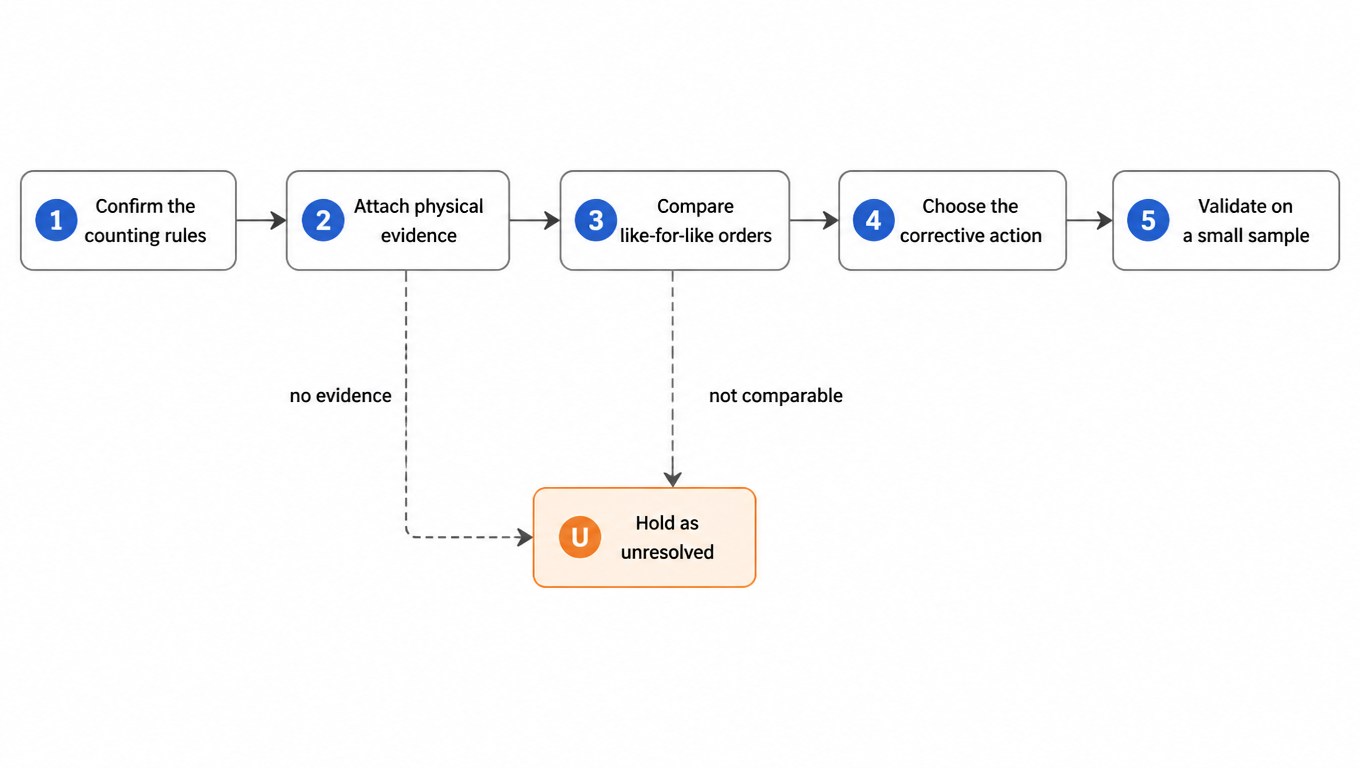
Flowchart: confirm the counting rules, attach physical evidence, compare like-for-like orders, choose the corrective action, validate on a small sample, with unresolved as the fallback state
Five steps, and the fallback state when evidence is missing

Confirm the counting rules. Decide what counts as a return event, what the denominator is, and which of the two metric families you are pulling from. The denominator should be orders shipped in the same window, not returns completed, so that returns which stall or fail partway through do not quietly disappear from the average. Write the rule down. A definition that lives only in someone's head will change when the person running the report changes.

Attach physical evidence. For each return event, link the outbound parcel record, the carrier's scan history, the timestamp the parcel was marked delivered, the customer's complaint, and what the receiving dock observed. An event without at least one independent piece of evidence stays in a separate bucket labeled unresolved. Do not distribute those events across carriers or customers to make the categories add up. Filling a bucket for neatness is how a real root cause gets hidden behind a fabricated one.

Compare like-for-like orders. Build the matched cohorts described above and look for a pattern that survives matching, not one that appears only in the raw totals. This is the step where most carrier theories die, and it is the step worth the most effort.

Choose the corrective action. Screen the candidate fixes for feasibility before pricing them out. A cheap fix that the product or the operation cannot support is not a cheap fix.

Validate on a small sample. Ship the change to a limited set of comparable orders, then re-measure with the same definitions and the same window length you used before.

The deliverable is a one-page priority table: the problem, the supporting evidence, the affected cost, the owner, and the method that will prove the fix worked. If a row cannot be filled in on all five columns, that row is not ready to be funded.

4. What to Observe, and Why the Join Has to Be at the Order Line

The audit needs five groups of variables, and the discipline is in the join, not in the collection.

GroupWhat to capture
Product and packagingSKU and batch, fragility characteristics, packaging version, pack completion record
Warehouse executionOrigin facility, pick verification, handoff timestamp, outbound photos where they exist
Outbound transportOrigin and destination ZIP, carrier and service level, the date promised at checkout, the date the parcel was marked delivered, exception records
Return evidenceCustomer's original reason, first complaint timestamp, customer photos, condition at receiving
Cost and windowReverse freight, replacement cost, processing labor, recovered value, whether observation windows are equal length

Join the outbound parcel and the return record at the order line, not the order. Split shipments, partial returns, and duplicate refunds will all inflate an order-level join, and inflated counts lead directly to inflated savings estimates. A single order that shipped in two boxes and returned one unit should contribute one event, not two or three.

Observation windows have to match as well. A cohort observed for 45 days will show more returns than a cohort observed for 90, purely because the second one gave customers more time to change their minds. That is a measurement artifact, not a service difference. If you are comparing carriers, channels, or SKUs, align the window before you compare the share, or you will spend the quarter chasing a calendar artifact. This is the same discipline that makes a returns shipping strategy hold together end to end: returns shipping strategy for DTC brands and 3PLs.

Editorial illustration of a returns inspection station from above, with a gloved worker photographing a dented housing beside a returned carton and an RMA sheet.
The receiving record is the only evidence that separates discovery from occurrence

5. Five Patterns, and What Each One Licenses You to Test

Certain patterns are worth acting on because they point at a specific place in the chain. Others are worth investigating because they point nowhere yet. The table below is the interpretive step of the audit.

What you observeWhat to verify nextWhat it licenses you to do
Similar damage recurs on one packaging version across multiple carriersPack design, product batch, condition at outboundTest a packaging change on that SKU
Wrong item or shortage recurs at one facility across multiple carriersPick, verification, and kitting recordsChange the warehouse process
After controlling SKU, pack, and lane, problems still concentrate on one serviceHandoff, in-transit events, delivery evidenceRun a small test of an alternative service
Item arrives intact with the customer, damage appears at the returns dockReturn packaging and the reverse legFix the reverse process, not the outbound one
Only vague reason codes exist, with no independent evidenceWhich records are missing and whether a sampling bias existsCollect more data first, assign nothing

Every row in that table is a direction for investigation, not a verdict. A pattern that survives matching on SKU, pack version, lane, and service is much stronger evidence than a pattern in a raw total, but it is still an association. The only thing that converts an association into a cause is a controlled change that moves the number. That is what the fifth step of the audit is for, and it is why the last row exists: with no independent evidence, the honest output is a data collection task, not a corrective action.

6. A Worked Example: 12,000 Orders, One Quarter, Evidence First

Numbers in this section are an illustrative scenario for a single-brand, single-facility operation. Work the same arithmetic on your own quarter; the point is the sequence, not these particular values.

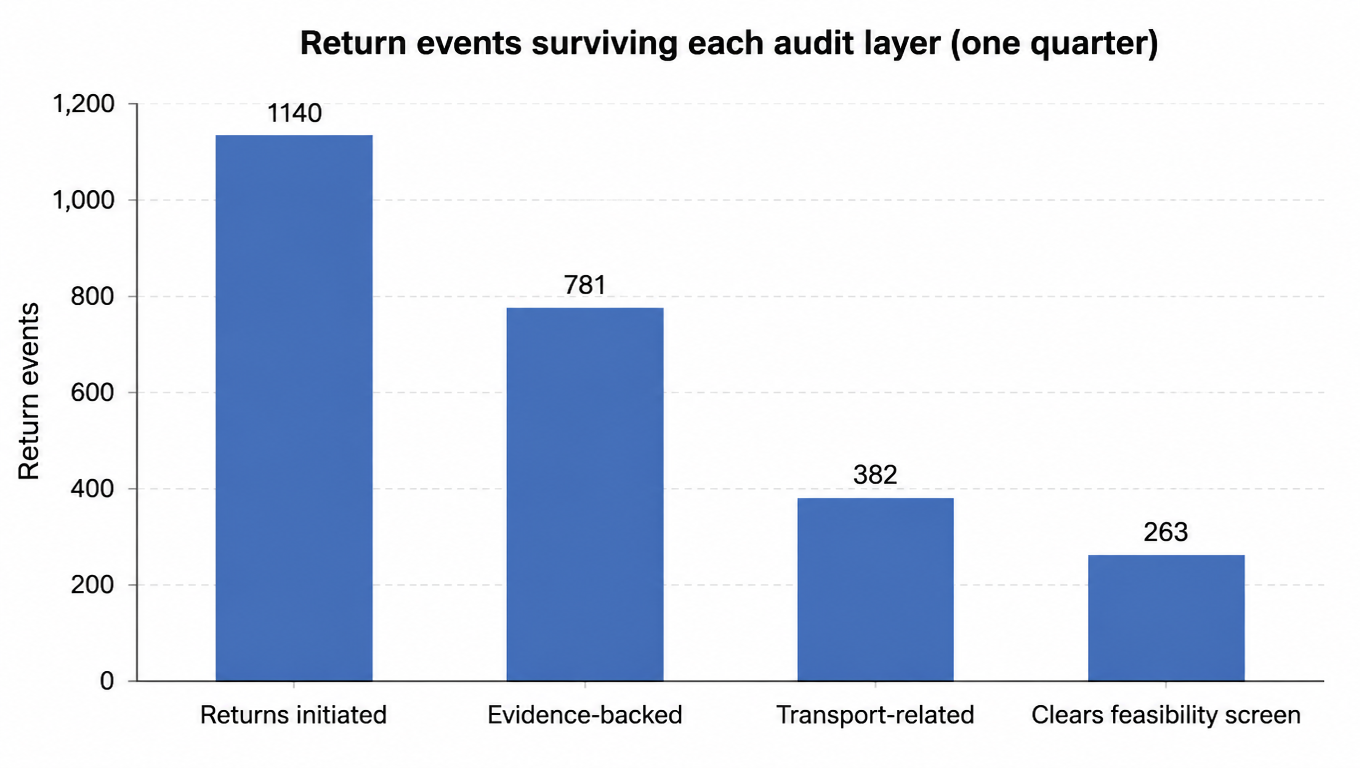
Start with the raw report. The brand shipped 12,000 orders in the quarter and saw 1,140 returns initiated, a rate of 9.5% against orders shipped. The report has 1,140 rows and one column of reason codes, and it is not yet usable for a spending decision.

Now run the evidence pass over all 1,140 events. In this scenario, 781 of them carry at least one independent piece of evidence: a scan consistent with the customer's claim, a timestamp outside the checkout promise, a customer photo, or a receiving inspection result. The remaining 359 events, about 31% of the total, have a reason code and nothing else. They go into the unresolved bucket and stay there.

Within the 781 evidence-backed events, 399 turn out to be non-transport causes: fit, preference, changed mind, duplicate orders. That leaves 382 events that are genuinely transport-related. Splitting those by where the chain broke gives the picture below, and the layering matters: roughly a third of the original 1,140 events are not actionable through shipping changes at all.

Bar chart: return events surviving each audit layer, 1140 returns initiated, 781 evidence-backed, 382 transport-related, 263 clearing the feasibility screen
Each layer removes events that were never actionable

Of the 382 transport-related events, 214 are physical problems, meaning damage, shortage, wrong item, or loss, and 168 are late arrivals that reached the customer intact. Broken down by where the chain failed: 92 packaging or pack execution, 71 warehouse pick and verification, 51 handling beyond what the pack spec should absorb, 63 checkout address data quality, 44 carrier handoff and first scan, and 61 linehaul missort.

Now price a single event without double counting. The fully loaded cost of one transport-caused return in this scenario is $19.20, built from reverse transportation and label cost of $8.10, receiving and inspection labor of $4.30, and non-recoverable value of $6.80 for units that come back unsellable. The refund itself is not added on top of the recovered unit, and the non-recoverable value is net of what was recovered, so the three components do not overlap. Separately, 96 of these events needed a replacement unit at $31.40 each in product and outbound cost, because the customer still wanted the goods.

Before any fix gets priced, each candidate passes a feasibility screen, and the gates run in a fixed order: does the fix apply to this product, can the customer actually execute it, can the warehouse receive and absorb it, and is the total economics better than the current state. Failing any gate stops the candidate and hands it to policy instead of operations. Applied to the 382 events, 263 clear all four gates and 119 do not. The 119 are not failures of the audit. They are events whose recurrence does not depend on a step the brand controls, and they belong in a different conversation about policy, not packaging.

7. Ranking, Retesting, and the Trap of a Fake Improvement

Rank candidate fixes by expected avoidable loss minus improvement cost, never by event count. A frequent, cheap-to-fix root cause should outrank a dramatic one that is rare.

Candidate fixEvents per quarterQuarterly avoidable lossQuarterly improvement costVerdict
Pick verification step on the affected SKU class71$2,651$298Fund first
Address validation at checkout41$1,007$240Fund
Packaging change for the fragile SKU74$2,488$714Fund
Pack spec upgrade across five SKUs33$1,073$1,068Marginal, re-scope
Earlier tender cut-off with a first-scan target44$845$1,150Does not pay back as scoped

Two of the five rows do not clear. That is the most valuable output of the exercise, because either of those two would have looked like an obvious fix in a meeting. The handoff row in particular is where teams tend to spend first: it feels like a carrier problem, and the arithmetic says the overtime costs more than the returns it removes.

Then validate on comparable orders. After the change ships, compare the same SKU class, the same packaging version, and the same lane mix, over a window of equal length, and require the number to move. If the product mix shifted because a new SKU launched mid-quarter, a falling return share may be nothing more than a different denominator wearing a success story.

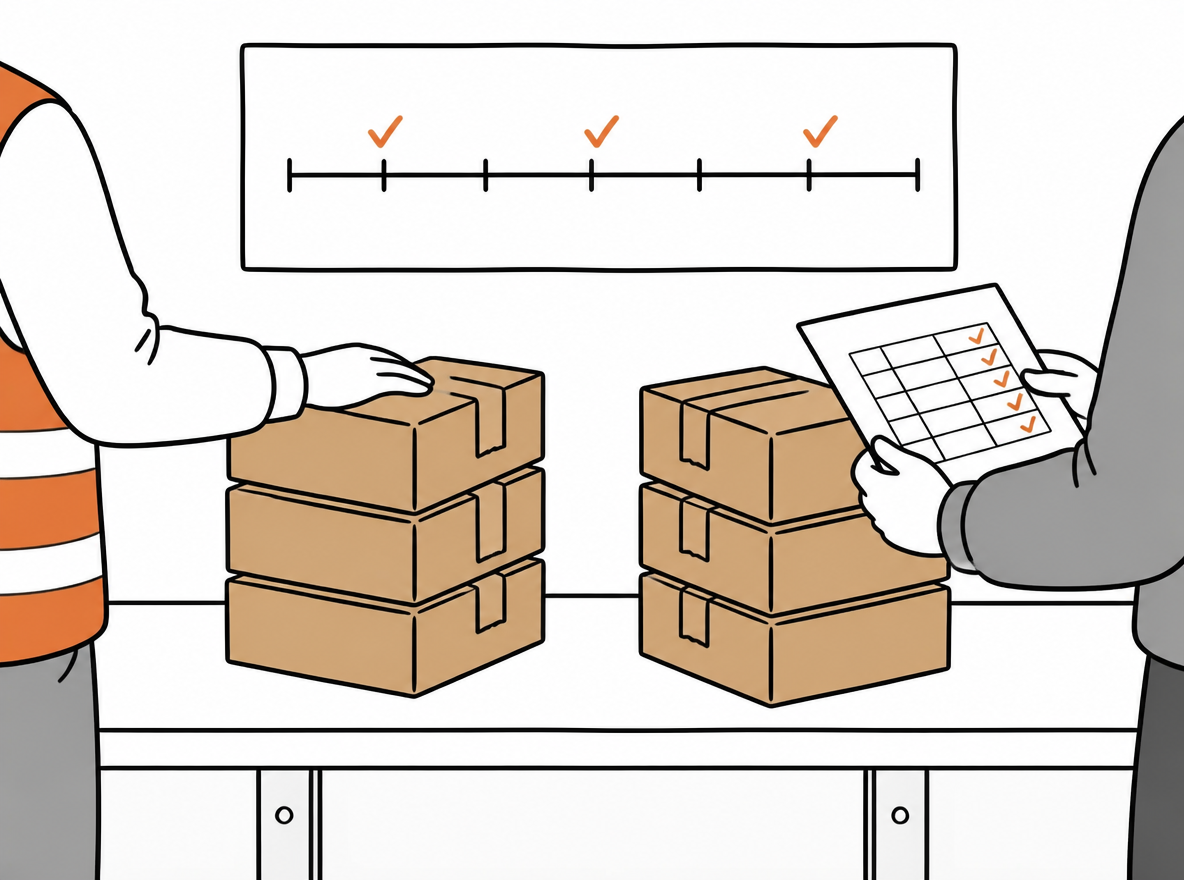
Editorial illustration of two stacks of identical parcels compared on a warehouse bench, with a printed table of figures and a tick-mark timeline board behind.
Only a like-for-like comparison proves the fix

One more measurement is worth keeping on the same page: the unresolved share. In the scenario above it started at 31%. A falling unresolved share means collection and attribution are improving, even before any corrective action lands. Tracking it stops the team from rewarding a clean-looking chart that was produced by assigning bad records to convenient causes.

8. When the Evidence Points at Carrier Service Choice

Most of this audit ends in your own operation. Some of it ends with a service decision, and that is the last row of the pattern table: after controlling for SKU, packaging version, lane, and service level, problems still concentrate on one service, and the matched comparison holds up over two consecutive quarters.

At that point the input you need is concrete: actual parcel dimensions and weights, origin and destination ZIP pairs, the delivery requirement for those lanes, and the volume you can commit. With those in hand you can compare the services and quotes available for exactly those parcels, validate on a small slice of real volume through the Portal, or wire the same comparison into an existing shipping workflow through the API if the volume justifies it.

Be clear about what the method is not. The audit described here is an analytical discipline you run on your own records; it is not an automatic returns attribution feature, and no tool hands you a defensible root cause without the evidence pass in step two. What shipping software can do is make the execution side measurable and consistent, so that the next audit starts from clean scans, accurate handoff timestamps, and comparable lane data rather than from a column of reason codes. If the return itself needs evidence preserved at the point of complaint, the checklist here covers that handoff: empty box and wrong item returns. And once a pattern survives matching, the way to compare services without turning it into a guess is a scorecard built for it: carrier performance scorecard.

Evidence in hand?

EasyShippingX is a channel-neutral shipping layer: one consistent way to compare US domestic carrier options and execute through a portal, a spreadsheet, or an API. When the audit points at service choice, the next step is comparing the available services and quotes against your real parcel dimensions, weights, origin and destination ZIP pairs, and delivery requirements, then validating on a small slice through the Portal. See pricing or book a multi-carrier workflow demo.

FAQ

No. A reason code is the customer's description of what they saw, and it exists to route a return, not to assign blame. It can be accurate or it can be the easiest option on a dropdown. Treat it as a direction to investigate, then verify it against your own records.
Run a full audit quarterly, and reset the clock whenever packaging changes, a carrier changes, or a new SKU launches. Keep observation windows equal in length, or the returns share will be polluted by how long you watched.
Because returns that stall or fail partway through drop out of the completed-returns figure and make the average look better than it is. With orders shipped in the same window as the denominator, every return that was ever initiated stays in the sample.
Put them in an unresolved bucket and leave them there. Do not distribute them across carriers or customers just to make the categories add up. Track the unresolved share: when it falls, collection and attribution are improving, and that is one of the audit's own success measures.
No. A pattern is a direction for investigation. It only becomes a cause after it survives matching on SKU, packaging version, lane, and service, and then moves under a controlled change. That is what the fifth step, validating on a small sample, is for.
When a candidate fix fails any gate of the feasibility screen: the product cannot support it, the customer cannot execute it, the warehouse cannot absorb it, or the total economics are not better than today. Failing any gate hands the issue to policy instead of pushing operations with a cheaper quote.