Last Mile Structure

How Fragmenting E-Commerce Is Rebuilding the U.S. Last Mile

Consider a hypothetical situation that stops being hypothetical almost immediately. One warehouse in the middle of the United States, one dock door, one team of pickers and packers. On the same afternoon that team ships an order from a brand's own storefront to a suburb of Denver, a marketplace order to a residential address in rural Georgia, and a social commerce order to an apartment building in Brooklyn.

The packages look nearly identical on the belt. They may even share a box size and a poly mailer. What differs is everything that decides how they should move: the margin each order carries, the destination type, the tracking expectations of the buyer, the promise made at checkout, and the consequences of a late or lost parcel.

That is the question this analysis works through. When the order mix changes, does the old method of assigning carriers still fit? For most operations the honest answer is that the method was never written down in the first place. It was inherited from a time when one channel produced most of the volume, and it survived because volume was steady and the destination mix was narrow. This article explains the structural shift behind the changing order mix, then gives shippers a framework for rebuilding a carrier mix around real shipment needs rather than brand familiarity.

Editorial illustration of a single loading dock at a U.S. fulfillment warehouse at dawn, three parcels of clearly different sizes and shapes waiting on the concrete apron with plain unlabeled shipping labels, a worker in a hi-vis vest checking a handheld scanner at the edge of the frame, fluorescent dock light spilling out behind them and cool blue morning light in front, ink outline with warm orange accents, slightly asymmetric composition with visible paper grain.
One dock, one team, three completely different delivery promises

Introduction: One warehouse, many delivery promises

Delivery promises used to be roughly uniform inside a single operation. A warehouse serving one channel could reasonably assume that most parcels shared a weight band, a service level, and a destination profile. Pricing decisions, packaging decisions, and carrier decisions could all be made once and revisited rarely.

Now the same dock serves orders whose only common feature is the physical act of leaving the building. An economy order for a low-value item and an expedited order for a high-value one can sit on the same pallet. A parcel bound for a dense metro ZIP and a parcel bound for a rural route with no street delivery travel through the same sortation process but do not have the same economics. The cost implications of that destination split are worked through in the analysis of the true cost of last mile delivery.

The practical consequence is that "our carrier" is no longer a single meaningful answer. The operation may have one carrier relationship, but it now covers shipments that behave like several different businesses. The rest of this article treats that mismatch as the central problem: not which carrier is best in general, but which shipment groups each carrier is actually suited to carry.

1. E-Commerce Fragmentation Changes the Shipping Problem

Fragmentation is easier to discuss as a slogan than as an operating fact, so it helps to separate it into three layers.

The first layer is sales channels. Orders arrive from marketplaces, from owned storefronts, and from social commerce surfaces. Each channel carries its own expectations about how quickly an order should be confirmed, dispatched, and delivered, and some channels impose handling rules that a brand storefront does not.

The second layer is shipment characteristics. Weight, dimensions, declared value, destination type, and the swing in daily volume during a promotion all differ by channel. A campaign that triples volume for three days does not triple it evenly: it usually concentrates the surge in particular SKUs, particular box sizes, and particular destination regions.

The third layer is delivery requirements. Some orders can travel on the slowest service that still meets the promise. Others need faster transit, richer tracking, or a signature on delivery. Some destinations require proof of delivery for a dispute to be resolved at all.

One boundary condition matters here, because it is easy to overstate. More sales channels do not automatically mean more warehouses, and they do not automatically mean lower delivery density. A multichannel operation can hold shared inventory and ship from one fulfillment network, which is precisely why channel expansion is attractive. Amazon's expansion of Multi-Channel Fulfillment to support merchants selling on Shein, Shopify, and Walmart, announced in September 2025 (Amazon announcement), is a useful illustration of that capability: one fulfillment network serving several storefronts. It is an illustration of a capability, not evidence about market share or about how average parcel weights are moving across the industry, and it should not be read that way.

The useful takeaway is narrower and more practical than a market thesis. Whatever is happening across the industry, the thing worth re-examining is your own order mix. A carrier assignment rule that was correct at one channel mix can quietly become wrong at another. The capabilities a multichannel operation needs first are set out in the multichannel readiness framework.

2. Legacy Carriers Are Reshaping Their Economics and Delivery Models

If shippers are rearranging their carrier mix, carriers are doing the same thing from the other side. Three lenses explain most of what looks like churn from the outside.

The first is customer and volume mix. Large carriers actively choose the business they want. Volume that fills a network at a low yield can be worth less than a smaller volume at a better yield, particularly when the capacity it consumes could serve a different customer segment. What looks like a carrier losing volume can be a carrier declining it.

The second is product economics. A lighter parcel is cheaper to move than a heavy one, but not proportionally so. The cost of completing one delivery includes a pickup stop, a sortation pass, a linehaul slot, and a final-mile stop. Most of those costs are driven by the number of stops and the shape of the route, not by the weight on the truck. This is the point where intuition fails most often, so it is worth stating the four ideas separately: light weight is not the same as low item value, low item value is not the same as a low shipping rate, a low shipping rate is not the same as a low carrier margin, and a low carrier margin is not the same as a service the carrier wants to keep selling.

The third lens is the division of labor inside the network. Pickup, sortation, linehaul, and final delivery do not have to be performed by the same company. A commercial network can carry a parcel across the country and hand it to another organization for the last few miles, or the reverse. Those divisions of labor are what produce the four network models in the next section.

The anchoring case for all three lenses is UPS. In January 2025 the company said it would reduce the volume it handles for Amazon by more than 50% by the second half of 2026, under an agreement in principle with Amazon (Supply Chain Dive; UPS annual report). That is a deliberate shift in customer mix rather than a capacity failure, and it is not a rounding error: UPS has said it eliminated roughly 2 million lower-yield Amazon pieces per day from its network (CFO interview).

The same period shows how unstable a delivery route can be even when the product name does not change. UPS had long handed a share of its economy parcel product, the service then called SurePost and now sold as Ground Saver, to the U.S. Postal Service for delivery to the door. When that postal contract expired at the start of 2025, UPS brought the volume in-house and delivered it on its own network instead (SurePost contract change). Then, in December 2025, the company signed a new agreement under which the Postal Service will handle final-mile delivery for a portion of Ground Saver and Mail Innovations volume beginning in 2026, and deliveries under the renewed arrangement were getting under way by early 2026 (renewed agreement; ramp-up).

Read those two timelines together and the lesson for a shipper is uncomfortable. Across roughly thirteen months, one economy product moved from postal final mile to fully in-house service and then partly back to postal, while the customer at the front of the chain was having its own volume cut in half. The service name survived throughout. What changed underneath it was the price, the access path, and the physical route the parcel travels.

The operational implication for a shipper is narrower but harder to act on: what a rate card implies about transit time and delivery path is a claim rather than a specification, and it deserves re-checking after any carrier announces a network or customer-mix change.

3. The Last Mile Is Becoming a Mix of Network Models

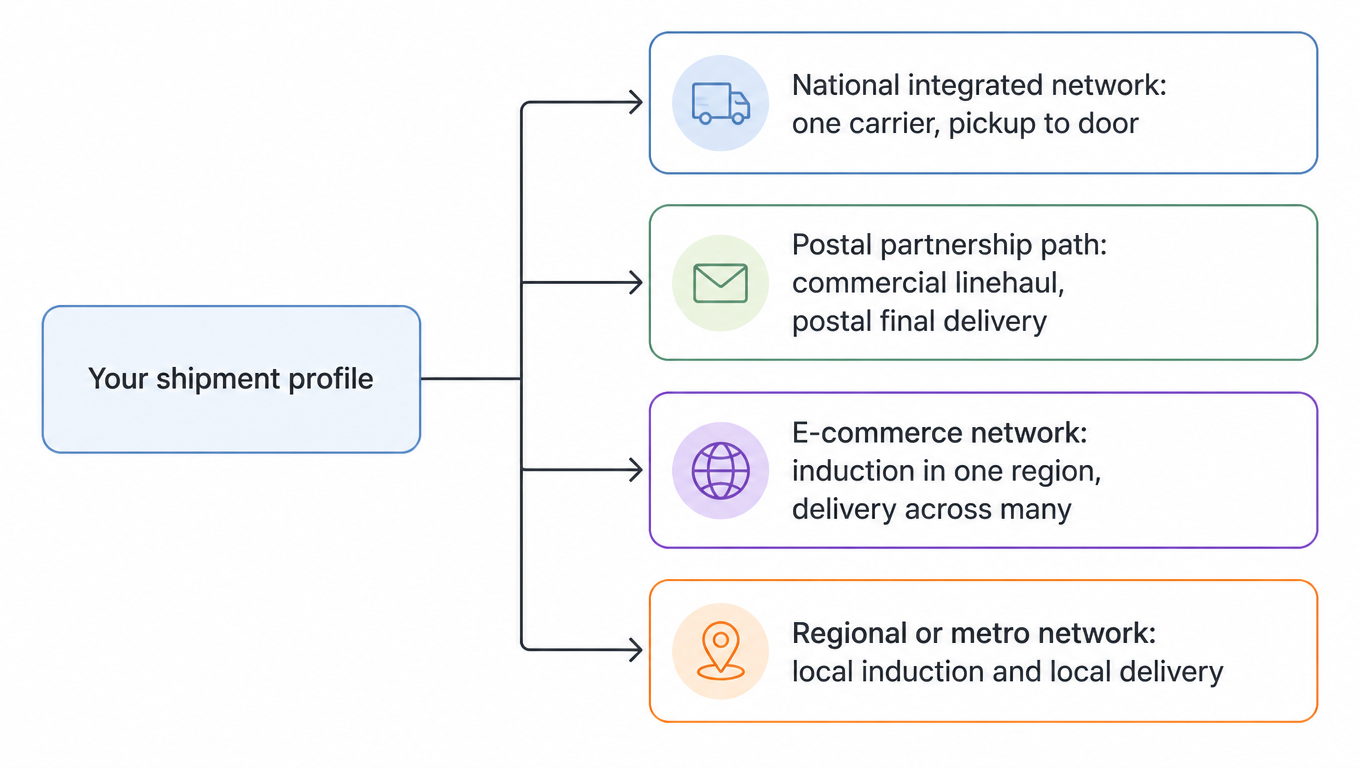
As delivery work gets divided differently, the useful way to think about the market is not as a ranked list of brands but as a set of network models. Each model has a different failure mode and therefore a different set of things a shipper must verify.

Flowchart branching from your shipment profile into four network models: national integrated network, postal partnership path, e-commerce network, and regional or metro network
One shipment profile, four different ways to inject volume
Network model What the shipper must verify
National integrated parcel networkProduct eligibility, transit time, special services, and the full set of fees
USPS direct service and postal partnership pathsThe actual handoff step, the final delivering party, and who owns an exception
E-commerce delivery networks expanding across regionsOrigin induction, destination coverage, and available capacity
Regional or metro-specialized networksShipment fit, cutoff times, and drop cost

The four models differ in who performs the last mile, where a shipper can inject volume, and how much of the journey runs on infrastructure the shipper has no visibility into. They also overlap. A national integrated network may use a postal path for some destinations. An e-commerce delivery network may look national in its marketing and behave regionally in practice. A regional network may be excellent for one metro and unusable for the next one over.

Flattening all of this into a single "alternative carriers" category destroys the only information that matters. The question is never whether regional networks are cheaper than national ones. It is whether a specific service can carry a specific group of your parcels from a specific origin to a specific destination under a specific promise. A detailed comparison of the major last-mile networks is already published on the site, and that page carries the brand-level detail; this section is deliberately about the structural differences that the comparison exposes.

4. Evaluate the Shipment Segment, Not Just the Carrier Brand

The decision unit for everything that follows is a combination, not a carrier name:

origin or induction point x destination ZIP x package characteristics x delivery promise

Each factor in that combination rules out options that a brand-level comparison would leave on the table.

Reaching the destination does not mean the carrier can pick up from your warehouse. A service that delivers well into a metro area may have no pickup route in your industrial park, which pushes cost into a linehaul you now have to arrange yourself. Some networks expect you to drop volume at an induction facility, and the distance to that facility belongs in the cost comparison.

Population coverage is not your order coverage. A network that reaches most of the U.S. population may still miss a disproportionate share of your orders if they concentrate in ZIP codes outside its densest lanes. The right question is what fraction of your actual order file meets the service's full conditions, which is a metric worth naming: shipment fit coverage. It is the share of the orders you are evaluating that genuinely qualify for a given service, after pickup availability, delivery coverage, package limits, and handoff requirements are all applied.

Meeting the weight limit still leaves dimensions, contents, and address type to check. Dimensional weight rules, oversized handling, lithium battery restrictions, and alcohol or signature requirements can each make a shipment ineligible on their own. Address type matters too: a residential delivery, a commercial address, a PO Box, and a parcel locker are not interchangeable endpoints.

Published transit time has to be combined with cutoff, handoff, and the buyer-facing promise. A two-day service that requires a midday cutoff may deliver in three days for a warehouse that packs in the afternoon. If the checkout page promised a date, the relevant question is not the published standard but whether the parcel reaches the door on that date at an acceptable rate.

The operational side of this check is covered in more depth in the guide to carrier serviceability validation, which is the right companion to this section.

5. Diversification Has Costs, and Shared Failure Points

Adding a carrier is usually presented as risk reduction. It can be, but it is also a change to a system that currently works, and the costs land in places that a rate comparison does not show.

The most commonly missed cost is the effect on existing terms. Volume commitments and negotiated discounts are volume-dependent. Moving a share of parcels to a new service can push the remaining volume below the tier that supports the original pricing, so the savings on the moved parcels are partly or wholly offset by a higher rate on the parcels that stayed.

The second is operational work. A second carrier means another induction step on the dock, another labeling or manifesting process, another set of cutoff times the packing team has to respect, more training, more reconciliation at invoicing, and more customer service paths when something goes wrong. In a small operation this work is often absorbed by the same people who were already at capacity.

The third is correlation risk. Diversification only reduces risk if the failure modes are independent. If two services depend on the same postal or regional network for final delivery, they will fail together during a weather event, a facility outage, or a seasonal surge. A carrier list that is long on paper can still be a single point of failure in practice.

The fourth is the backup that has never been tested. An account that has never carried live volume has no validated capacity, no proven handoff, and no established exception path. It is a name in a spreadsheet, not a fallback. A fallback is only real after it has moved parcels and produced clean scans and correct invoices.

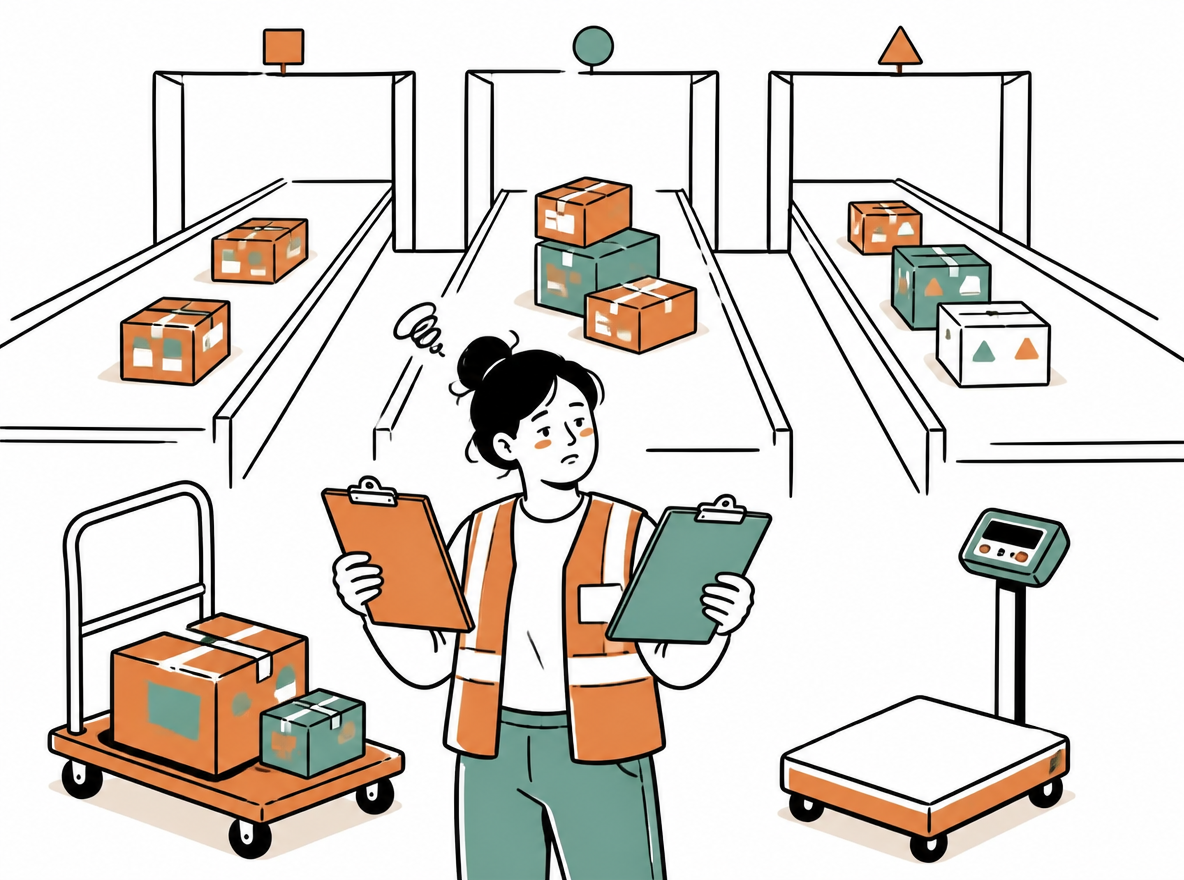
Hand-drawn illustration of a warehouse dock cross-section with three separate induction lanes running in parallel, each stacked with a few parcels and tagged with a small colored route marker, a supervisor in the foreground comparing two clipboards with a slightly tired expression, a rolling cart and a scale pushed to the side, loose ink line work with warm orange and muted teal fills, generous white space, gently humorous.
One more induction lane means one more set of cutoffs and reconciliations to run in parallel

The mix cost is therefore better written as a sum than as a rate:

freight and surcharges + access transportation + added operational cost + net exception cost + incremental cost from changed contract terms

Two things follow from that formula. First, the comparison must be run on the whole mix rather than on the moved parcels in isolation, because the second term can be negative and the last term can be positive. Second, delivery performance has to be read alongside invoice price. A service that is cheaper per label and produces more exceptions, more customer service contacts, and more refund claims has not necessarily reduced cost. The conditions under which a regional network genuinely wins are spelled out in the guide on when a regional carrier actually saves money, which complements the cost logic here. Making that mix comparable in the first place is the problem that multi-carrier shipping strategy takes on.

6. A Five-Gate Framework for Diversifying with Confidence

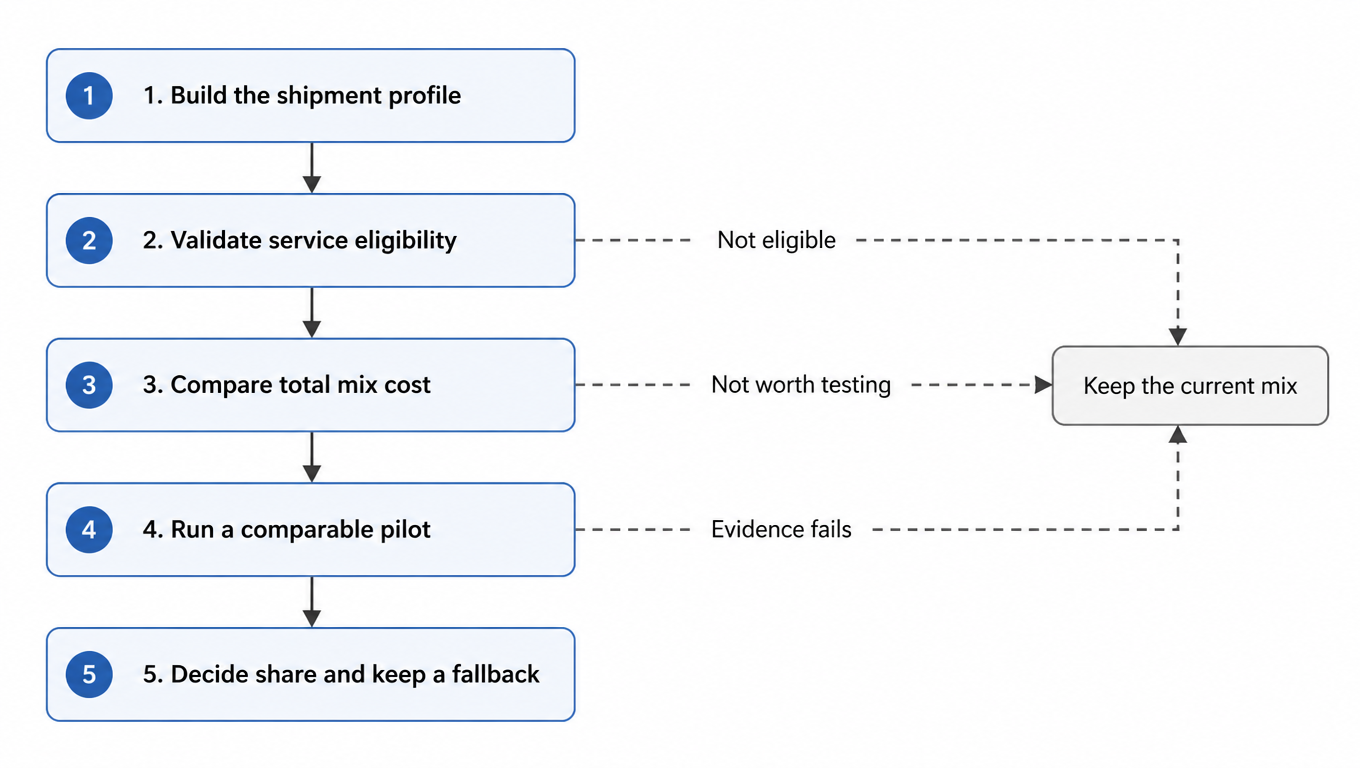
The practical question is not whether to diversify but how to decide, shipment group by shipment group, without turning the operation into an experiment. Five gates, each with a defined output, keep the decision orderly.

Flowchart of five gates in sequence: build the shipment profile, validate service eligibility, compare total mix cost, run a comparable pilot, decide share and keep a fallback, with bypass edges returning to the current mix
Each gate can end the decision on its own
Gate Core work Decision output
1. Build the shipment profileAnalyze origin, destination, package, promise, cost, and exceptionsRepresentative shipment groups and a current baseline
2. Validate service eligibilityConfirm pickup, coverage, package limits, handoff, and capacityEligible, conditionally eligible, or not applicable
3. Compare total mix costRecompute the cost of the new service plus the volume left with the original carrierWhether the whole plan is worth testing
4. Run a comparable pilotSelect representative orders and keep a matching control groupDelivery, exception, and invoice evidence
5. Decide share and keep a fallbackScale, cap, or pause based on observed performanceAn executable allocation and a rollback arrangement

Gate one produces the baseline that every later comparison depends on. It is built from a period of real shipment data long enough to include an ordinary week and, if possible, a promotional week. The output is a small number of shipment groups that behave alike, each with its current cost and its current delivery performance.

Gate two is the eligibility check described in the previous section, with one addition: capacity. A service can be eligible on paper and unavailable in practice during the weeks you need it most, so the conversation with the provider should include how volume is accepted and what happens when the network is full.

Gate three is where the mix cost formula is applied. The output is not a savings figure but a decision about whether the plan is worth testing at all. Many proposals can be closed here, which is the point: it is cheaper to reject a plan on paper than after a pilot.

Gate four is a pilot designed so that the evidence means something. Representative orders, a control group still moving on the current arrangement, and a commitment to look at both cost and delivery outcomes. The metrics worth tracking are specific:

  • Whether the first real acceptance scan happens when the service says it should
  • Whether the buyer-facing promise date is met
  • Loss, damage, returns, and customer service contacts attributable to the shipment
  • Whether proof of delivery is complete for the shipments that require it
  • The gap between the quoted rate and the mature invoice, including surcharges and adjustments

Gate five turns evidence into an allocation. Performance that holds up justifies more volume; performance that does not justifies a cap, a pause, or a return to the previous arrangement. The output should be written down, including the conditions that would trigger a rollback, so that the decision does not depend on anyone's memory during peak season.

Notice what this framework deliberately does not supply: a standard pilot length, a standard allocation percentage, or a standard on-time threshold. Those numbers depend on your baseline, your order mix, and the promise you made to your buyers. Importing someone else's threshold is how a reasonable framework produces an unreasonable decision.

7. How the Framework Changes Three Shipping Decisions

The framework is easier to trust when it is applied. The three cases below are hypothetical scenarios, constructed to show how the same five gates produce different conclusions. They are not drawn from any customer's account.

Case one: light apparel orders concentrated in destination. Domestic orders with low weight, moderate value, and destinations clustered in a handful of metros. Gate one shows a dense lane profile, which is exactly the shape a regional or metro network can serve well. Gate two is where the case turns: the network may have no pickup in the warehouse's area, so the real question becomes the cost and reliability of the induction step. If the drop cost and cutoff are workable, a pilot is reasonable. If they are not, the dense profile is worthless and the current arrangement stays.

Case two: dispersed destinations including rural addresses and PO Boxes. Orders spread across many states, with a meaningful share going to address types that some networks do not serve. Gate two eliminates several candidates immediately, because special address handling is an eligibility question, not a price question. The remaining comparison is between services that genuinely cover the tail of the destination mix, and the relevant metric is coverage of the actual order file rather than population coverage. Where no alternative covers the tail, the correct decision may be to split by destination type and keep the existing service for the hard addresses.

Case three: a 3PL with multiple clients and sharp promotion swings. Several client brands share the dock, each with different delivery promises and different packaging. Gate one is harder because the shipment profile has to be built per client rather than per warehouse, and gate two has to confirm that a candidate service can absorb a promotional peak without displacing other clients. Reconciliation and exception handling weigh more heavily here than headline rate, because the cost of a billing dispute is multiplied across client accounts. A pilot is appropriate only if it can be isolated to one client, so that the evidence is attributable and any failure is contained.

Across all three cases, the pattern is the same. The answer changes with the shipment profile, and the evidence that settles the question is specific to the operation. There is no configuration that is correct for every warehouse, which is why the framework is a process rather than a recommendation.

8. Where EasyShippingX Fits in the New Last Mile

Everything above is a business decision: which shipment groups exist, which services are eligible, and what the combination actually costs. Once those decisions are made, they still have to be executed shipment by shipment, at the volume the warehouse actually runs.

That execution layer is where EasyShippingX operates. Teams compare rates between USPS and supported last-mile services to see how a shipment group prices out across the options available to their account. Labels are created through the Portal, through Excel, or through the API, so the same workflow can serve a small operation and one that has automated its order flow. Tracking is available for supported services, and shipment charges, invoices, and applicable refund records can be reconciled against what was expected.

Two boundaries are worth stating plainly. First, the framework in this article, including shipment scoring, routing logic, and automatic failover, is an evaluation method, not a description of features on the platform. Second, the carriers discussed in this research are not automatically available for every EasyShippingX account. Actual service depends on account setup, shipment conditions, and current coverage, so the practical first step is to check what is available to your account before designing around it.

A reasonable starting point follows directly from gate one. Assemble your shipment profile: origin ZIPs, destination mix, package weights and dimensions, shipping volume, and delivery requirements. Compare the carrier services available to your account through EasyShippingX, then validate the fit with a controlled pilot rather than a full cutover.

Conclusion: Build a carrier mix you can verify and adjust

The shift described here is structural rather than dramatic. Order mixes have widened, carriers are choosing the business they want, and the last mile is increasingly divided among networks that each do part of the job. None of that requires a shipper to act immediately, but it does make an unexamined carrier arrangement harder to defend.

A concrete starting point is more useful than a strategy statement. Take one warehouse and one set of representative orders. Fill in three things for each shipment group: which services are actually eligible, what the total mix cost really is, and how the current arrangement performs on delivery. Most operations discover that the baseline was never as well documented as they assumed.

From there, the discipline is repetition. Revisit the profile when the channel mix changes, when a carrier announces a network or customer-mix shift, and before peak season, when capacity and cutoff times stop behaving the way they did in the spring. The goal is not a longer carrier list. It is a carrier mix that can be explained, measured, and adjusted when the evidence changes.

Sources

  1. Amazon Multi-Channel Fulfillment Expands its Support of Merchants on SHEIN, Shopify, and Walmart (Amazon, September 2025)
  2. UPS to cut Amazon volume by more than 50% (Supply Chain Dive)
  3. UPS Annual Report on Form 10-K for the year ended December 31, 2025 (UPS Investor Relations)
  4. UPS CFO on the lessons learned from scaling back Amazon (Fortune)
  5. UPS SurePost volume shifts away from US Postal Service after contract expiration (Supply Chain Dive)
  6. UPS, Postal Service lock in renewed Ground Saver deal (Supply Chain Dive)
  7. UPS ramping up Ground Saver deliveries handled by USPS (Supply Chain Dive)

Methodology: the statements about UPS and Amazon volume arrangements, the postal contract changes, and the economy product's final-mile path are drawn from the public sources listed above. The remaining material on network models, the decision unit, and mix cost is the author's analytical framework, and the cases and formulas are a replaceable evaluation method rather than a quotation or service commitment from any carrier or platform.

Start with the shipment profile, not with a carrier

EasyShippingX is a channel-neutral shipping layer: it compares US carrier options in one place and executes them through the Portal, Excel, or the API. Running one set of representative shipments through the rate calculator first shows what those parcels cost and which services are available on your own account, before any network conversation begins.